Design the User Interface > Configuring components > Configuring a Report component
  

Configuring a Report component

The Report component visualises the report data of the individual records. The users can add multiple widgets to display data as charts.
    1On the Page Components tab of a custom page, drag the Report component to a section.
    2Click Save.
The following image shows the Report component of a record in the classic experience:
The image shows the Reports component of a record in Customer 360 SaaS. Users can add charts using the Add Widgets button.
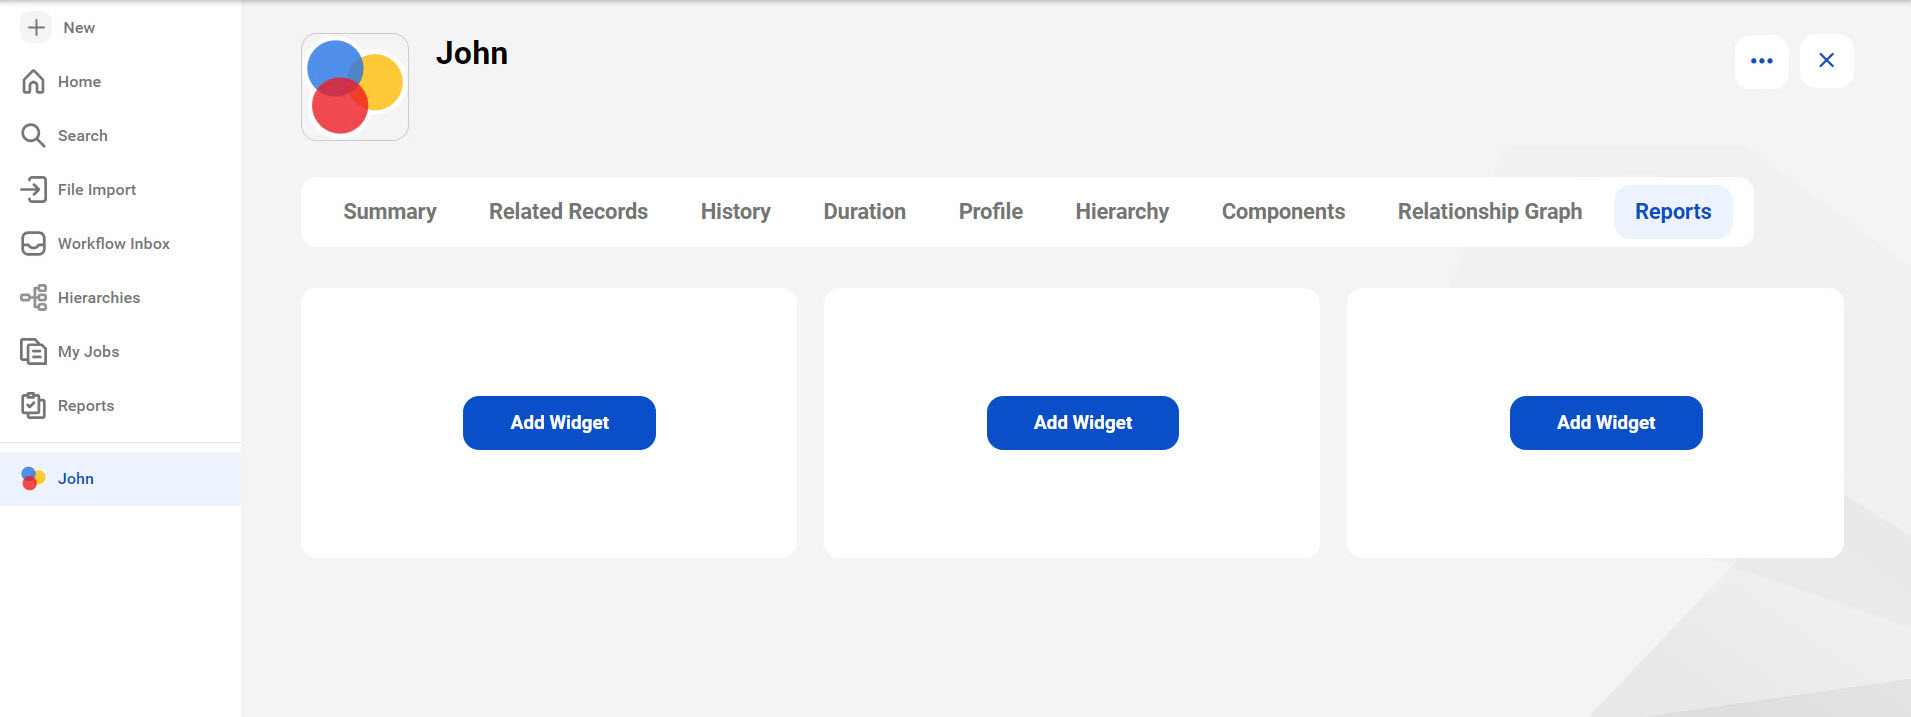
The following image shows the Report component of a record in the new experience:
The image shows the Reports component of a record in Customer 360 SaaS. Users can add charts using the Add Widgets button.