Performance
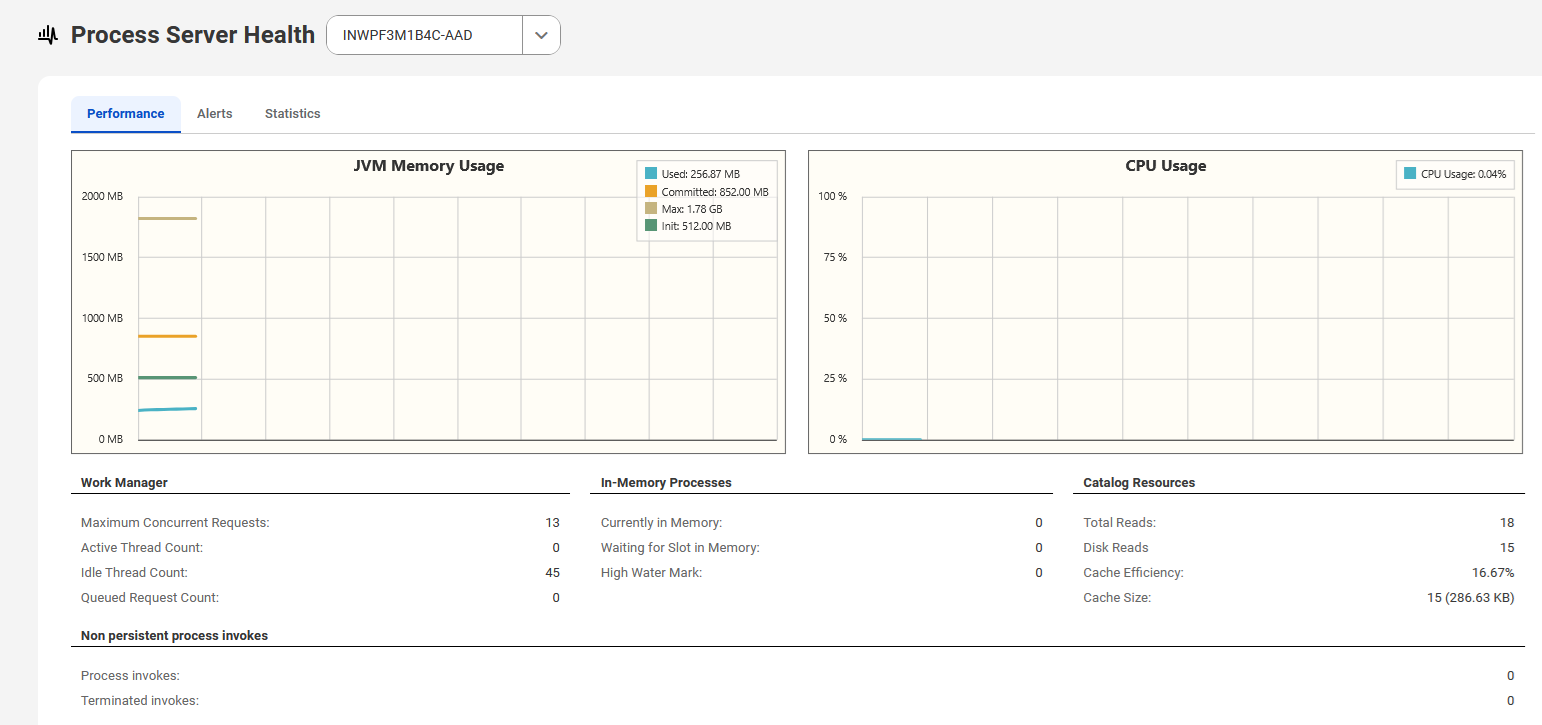
The Performance tab displays the following details:
- •Overall performance data
- •Performance and throughput of service requests
- •Resource and service bottlenecks
The following image shows the Performance tab on the Process Server Health page:
The statistics show a snapshot of what was in memory when you first open the page. Refresh the page to get updates.
These statistics let you ask questions such as:
- •How many requests are being sent to the server?
- •How long is the queue?
- •How many requests are waiting?
- •How long does it take to provide a response?
- •How long is it taking for the server to return from service calls?
- •Should I increase the work manager limits set on the Server Properties page?
After you run a load test, you can watch the metrics and set or reset configuration properties.
Platform Support
As you analyze performance in relation to your application server, keep the following in mind:
- •Statistics important to consider before changing other settings include:
- - CPU Utilization—graph over time interval
- - JVM Memory Usage—graph over time interval
- - Database Connection Pool—available, in use, waiters, and high water marks

