Configure the lineage graph to specify data granularity and control the type of assets and data flows that you see. You can also apply business context through overlays and simplify complex flows using filters.
You can access the configuration hub from the Manage Configuration icon on the lineage toolbar. In the configuration hub, you can select and apply data lineage levels, filters, overlays, and add rules to control the assets you see in the lineage. Use the options in the configuration hub to customize an asset's lineage graph for specific governance or technical analysis requirements.
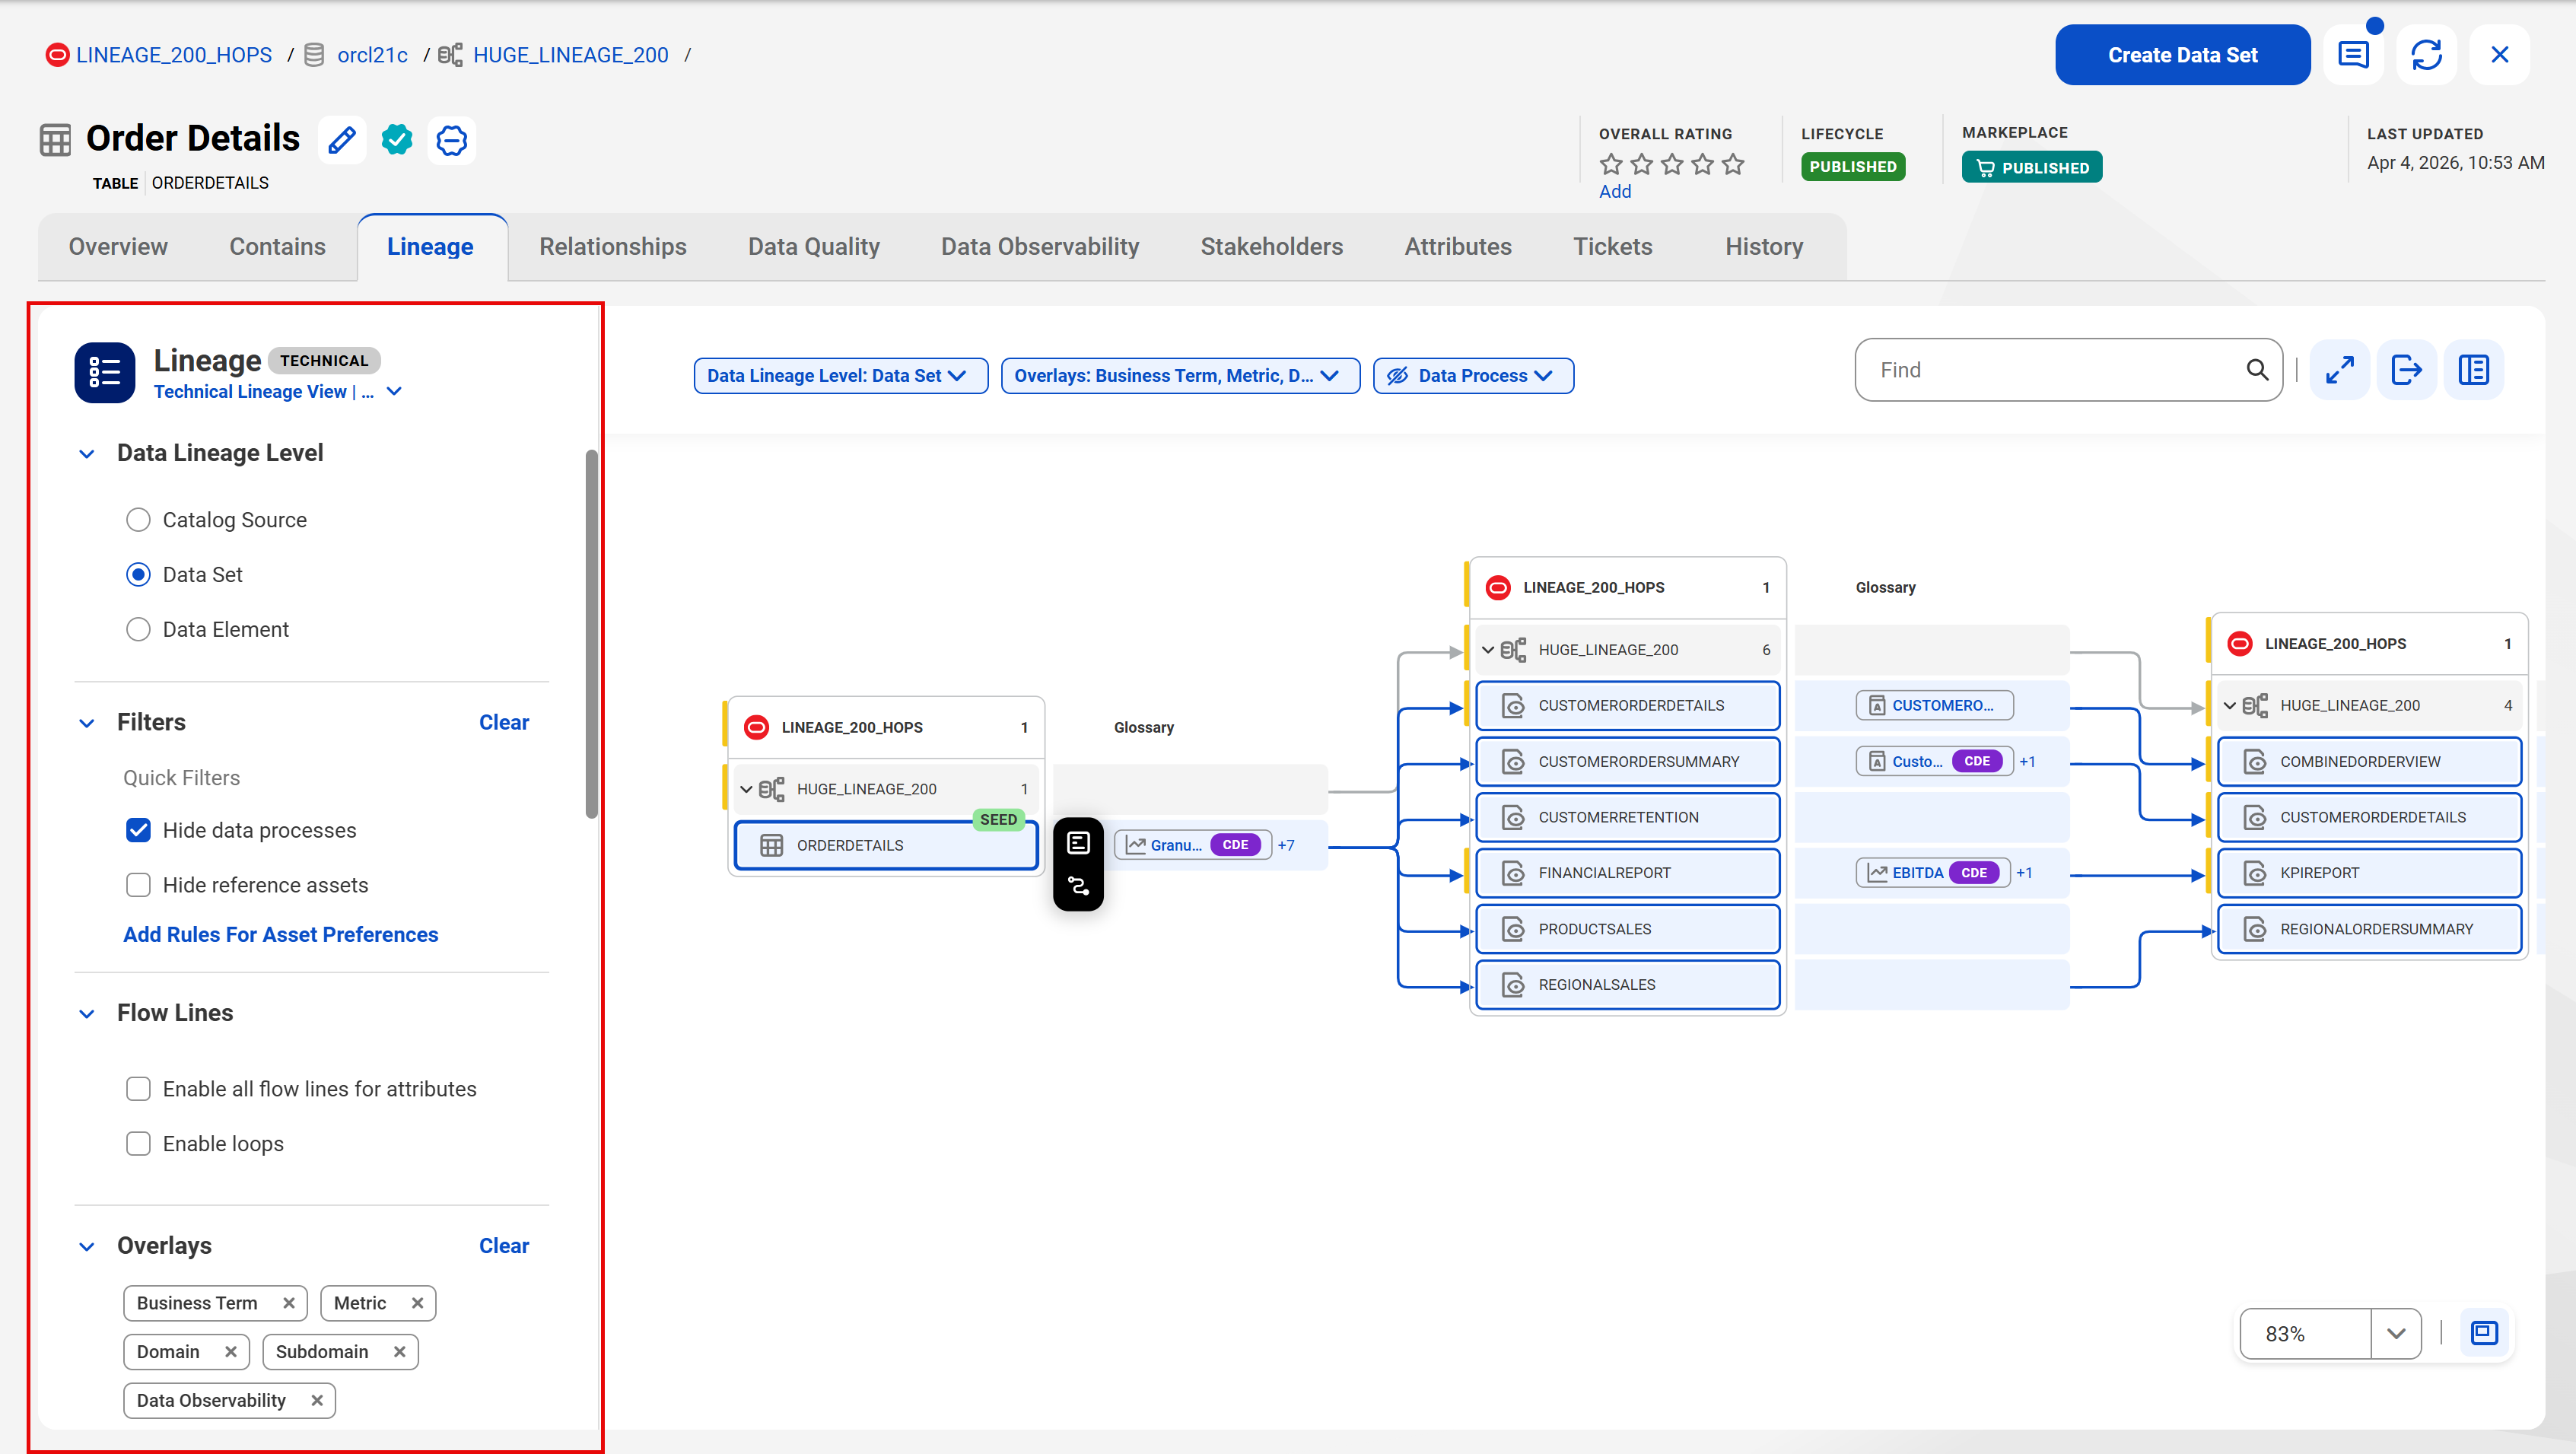
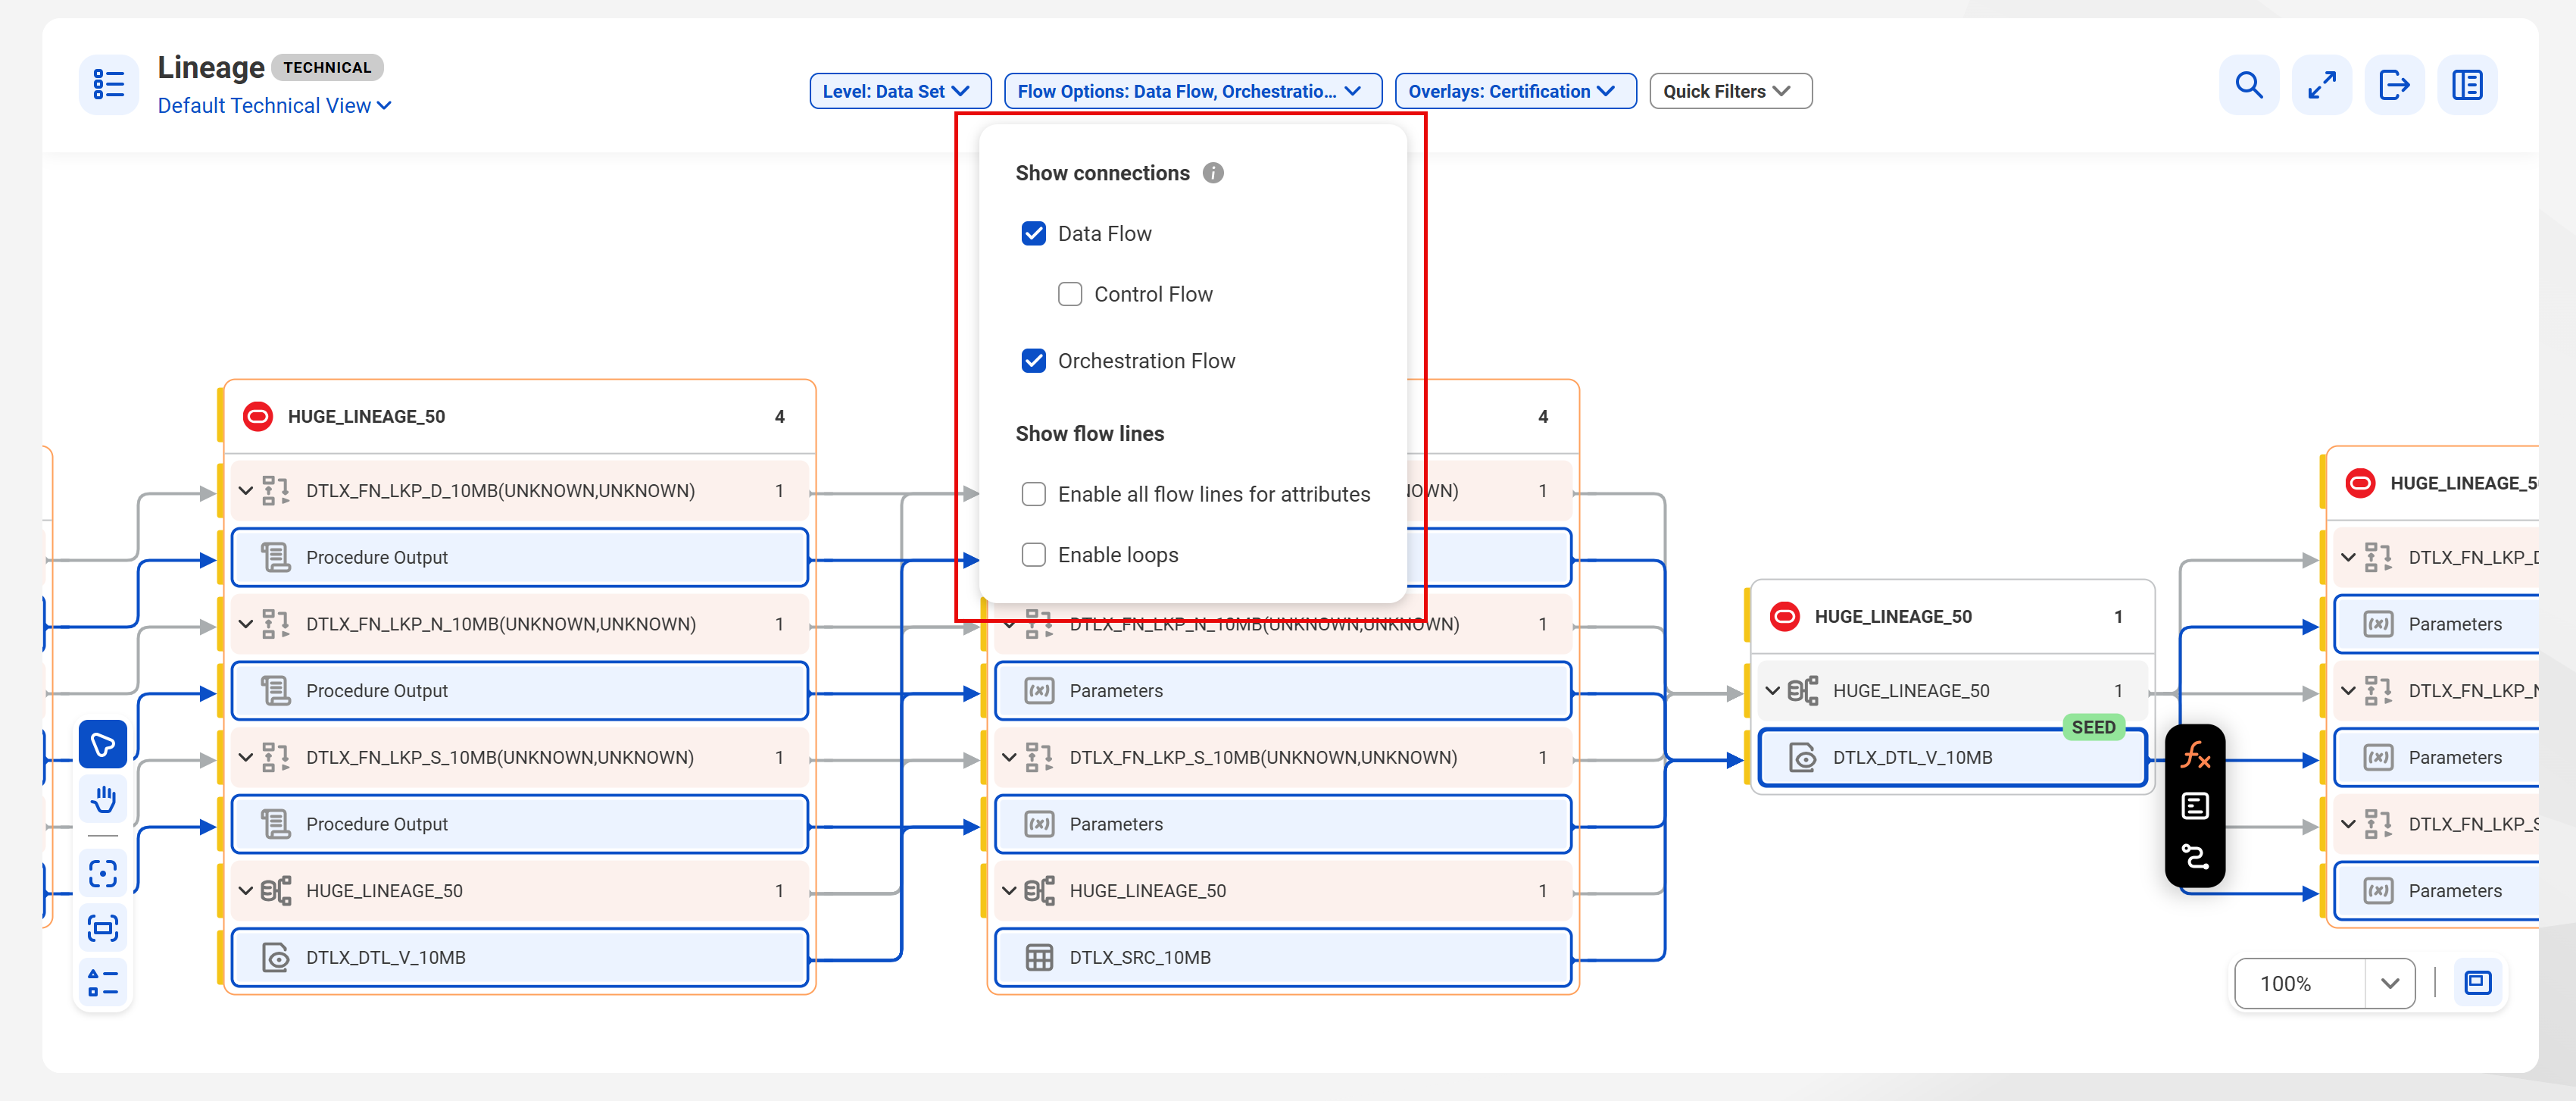
The following image highlights the lineage configuration menu on the Lineage page of a sample technical asset:
The Manage Configuration hub provides the following configuration options for your lineage.
Data lineage levels
Based on the granularity of the data that you want to see in your lineage, you can choose to view data lineage at the following levels:
•Catalog source. The highest lineage level that you can see for technical data sets. At this level, the data flows from one catalog source to another, with the lineage aggregating data from the data element or data set level.
•System. The highest lineage level that you can see for system assets and business data sets. At this level, the data flows from one source system to another, with the lineage aggregating data from the data set level.
•Data Set. A high-level lineage that shows how data flows from one technical or business data set to another without drilling down to the constituent data element level in the data flow. For example, an Oracle table, an SQL table, and an Amazon S3 flat file are all considered technical data sets.
•Data Element. A granular level lineage that displays how the data elements belonging to a technical data set are involved in the data flow, how data flows from source to destination, and how the data is transformed.
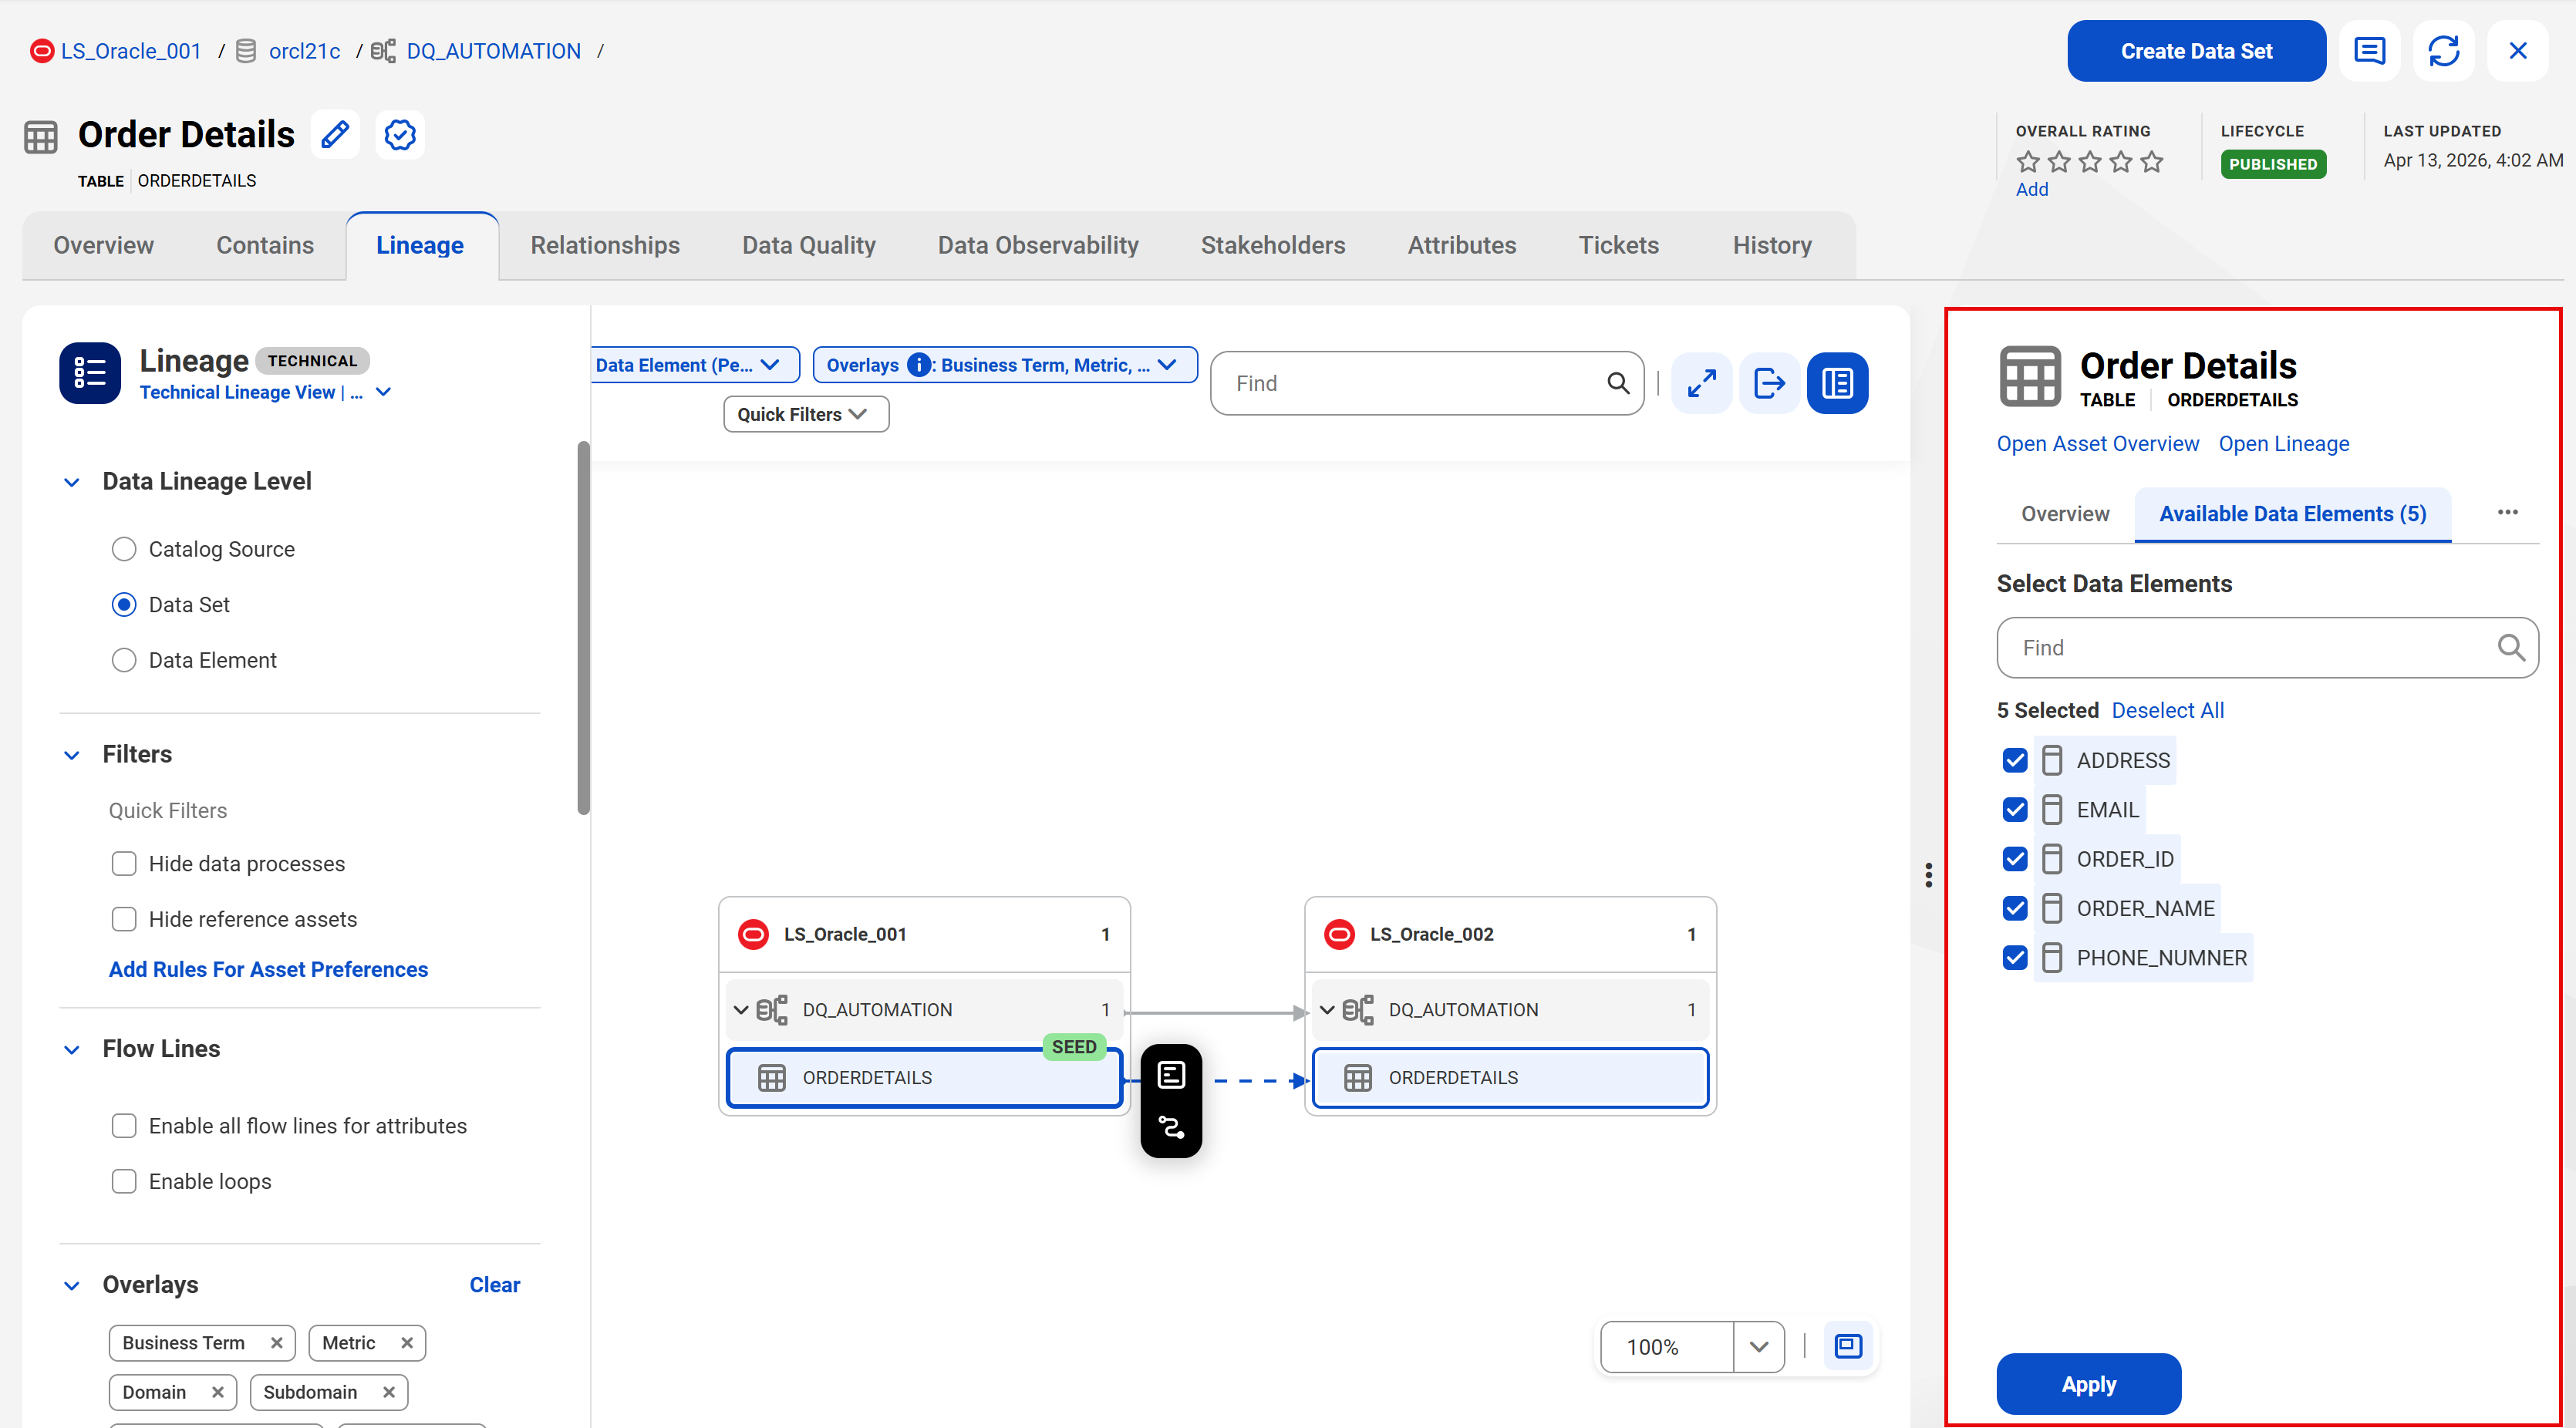
You can switch from one lineage level to another to define the granularity of data that you want to see in the lineage. When you switch from a data set level lineage to a data element level lineage, you can select, from the preview pane, specific data elements to include in the lineage.
The following image shows the preview pane for selecting one or more data elements to include in the lineage when you switch from data set level to data element level lineage:
Filters
Use filters to focus on specific assets within the lineage. You can apply the following quick filters and rules on your lineage:
•Hide data process. You can apply this filter only for technical assets while viewing the technical lineage. Use this option to hide all data processes in an asset's lineage to simplify complex lineage visualizations. Data process in lineage refers to objects that perform transformations or other operations on data. For example, data process objects include mapping tasks, mapping task instances, stored procedures, ELT pipelines, and so on.
If you apply this filter, you might see fewer nodes in the lineage. Additionally, if you expand the lineage by a single hop and the adjacent hop is a data process node, then the expansion might not display any new hops until you expand subsequent hops in the lineage.
•Hide reference assets. You can apply this filter only for technical assets while viewing the technical lineage. Use this option to hide all assets from reference catalog sources.
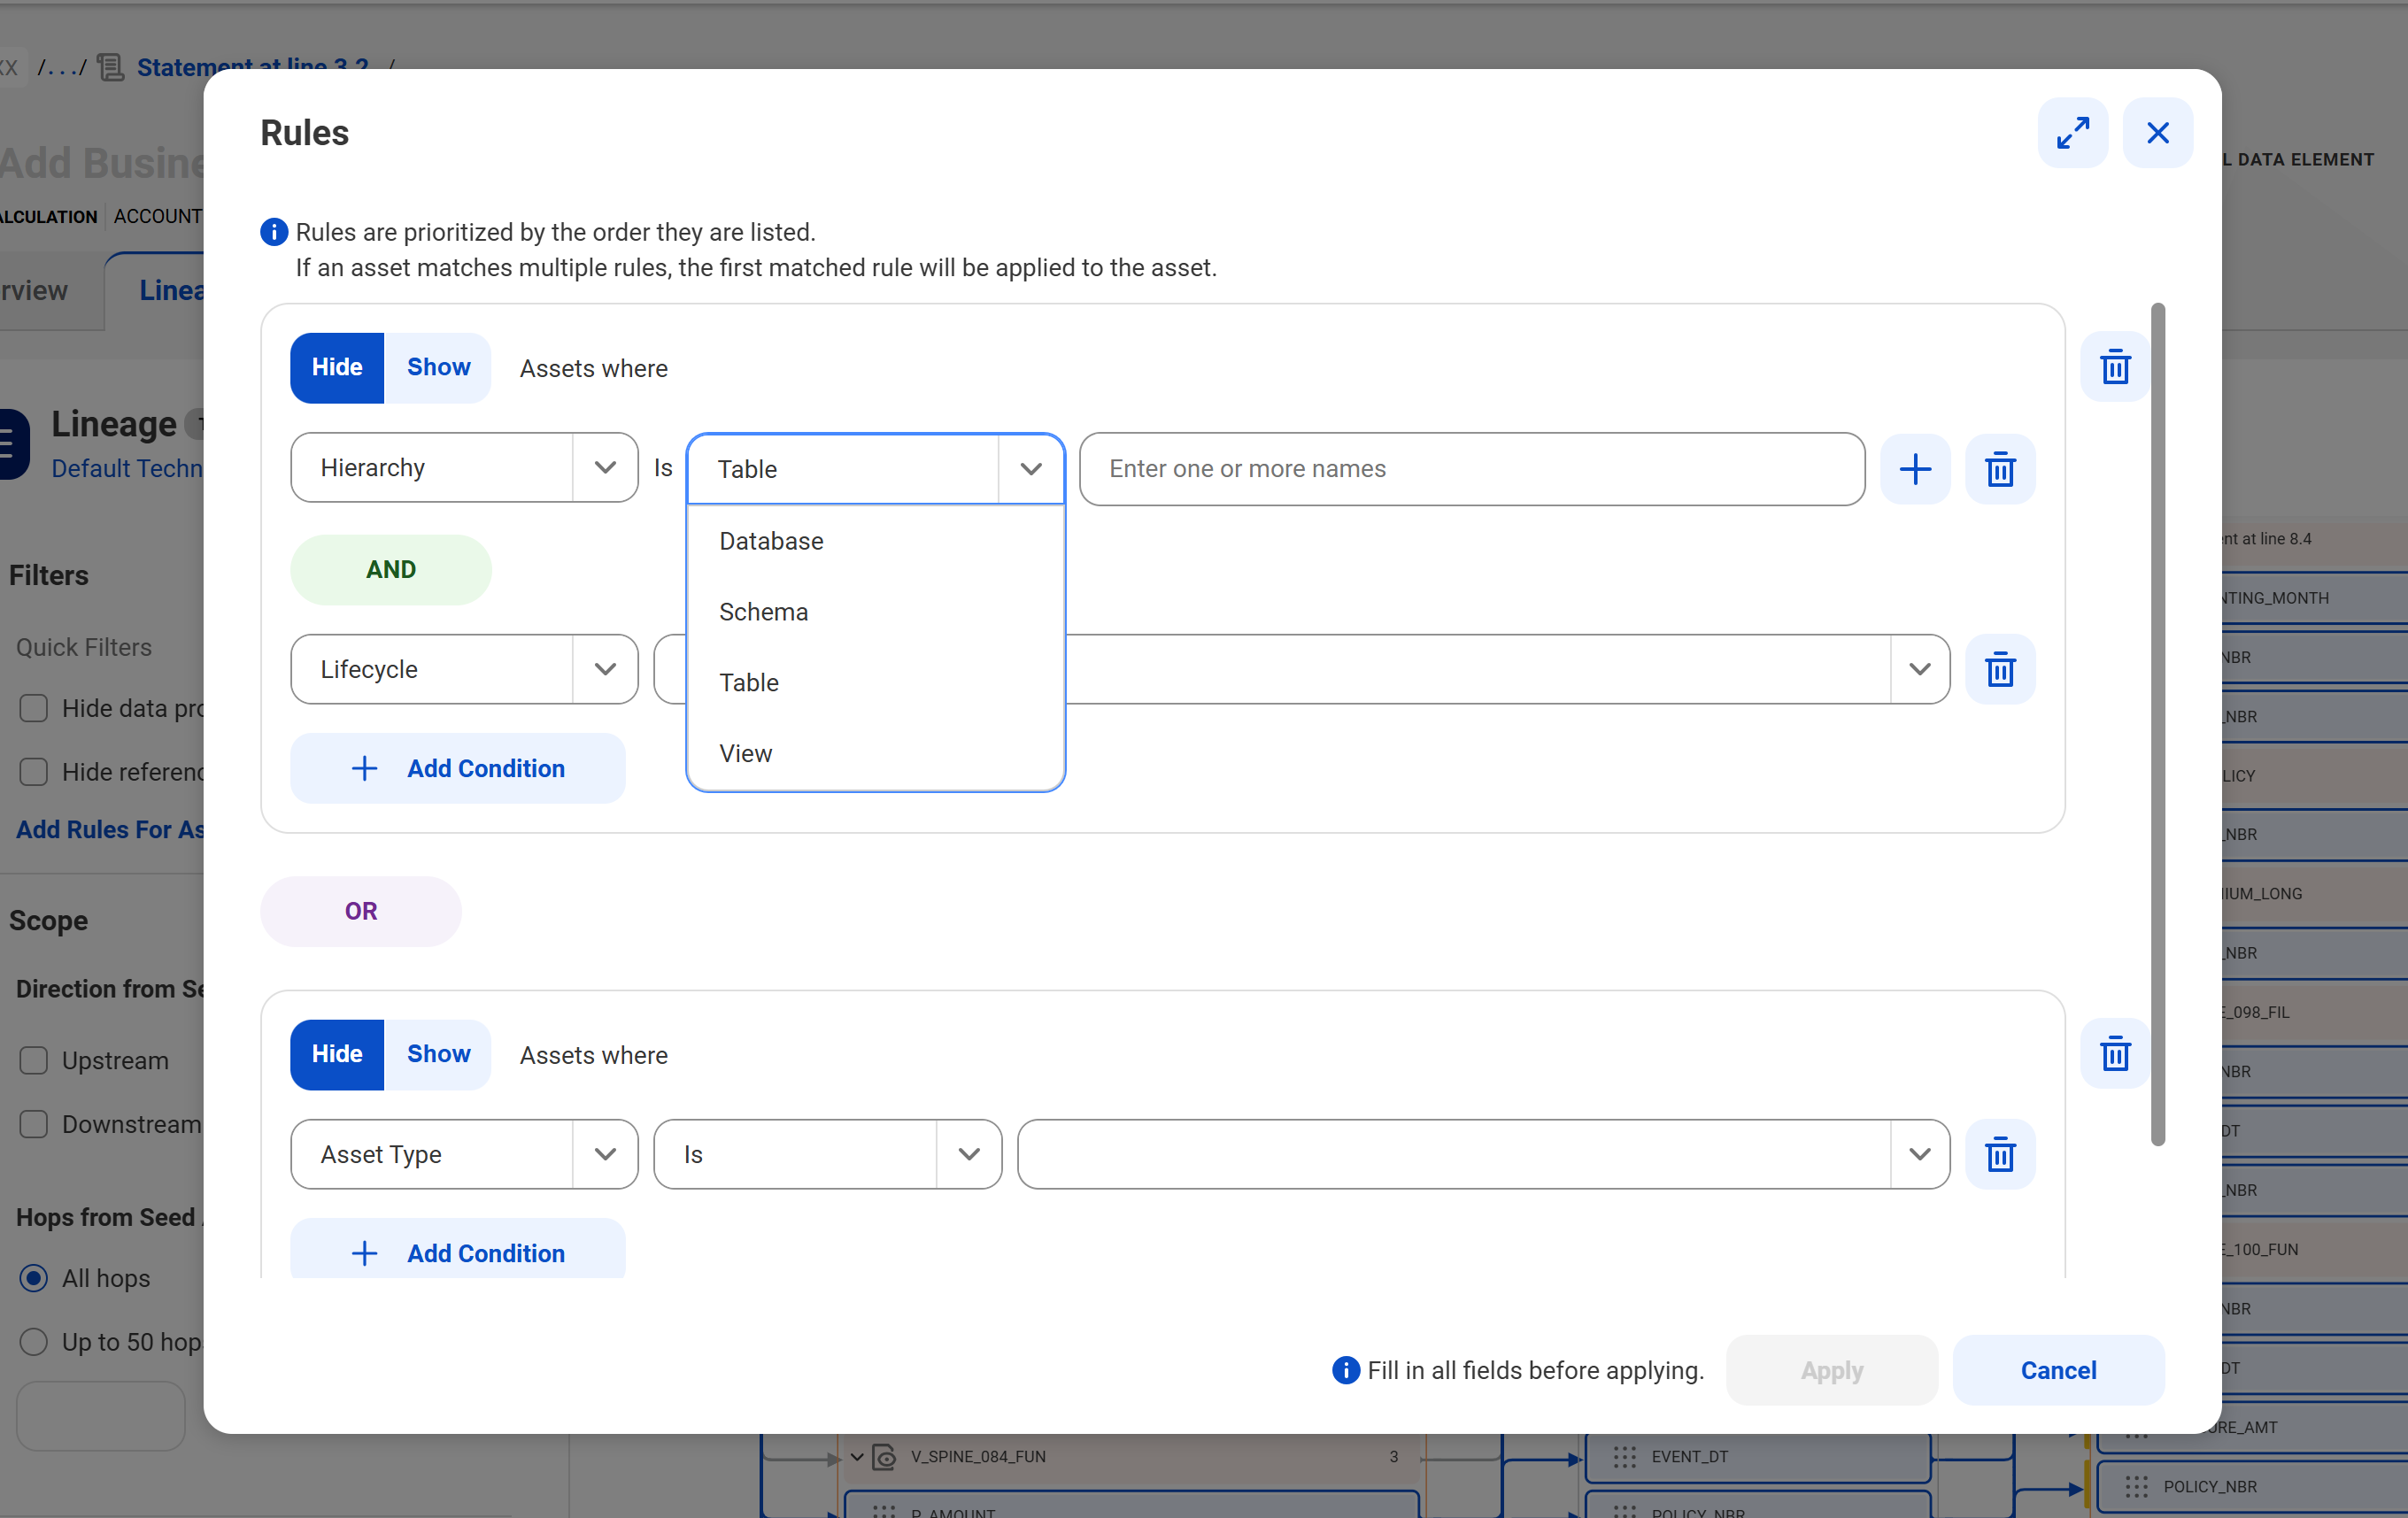
•Add Rules For Asset Preferences. In addition to the quick filters, you can create advanced rules to show or hide assets in the lineage based on criteria such as asset name, asset type, asset hierarchy, and lifecycle status of the assets. You can combine multiple conditions in a single rule using the AND logic, or combine multiple rules using the OR logic to precisely define the scope of your lineage. You can also build rules based on asset hierarchy levels to show or hide assets in a specific hierarchy.
Note:
The rules to hide or show assets apply to the lineage level selected for the view. To filter assets in an Data Governance and Catalog lineage, create rules that are specific to each lineage level.
The following image shows the rule builder where you can define rules for asset preferences:
Set the scope for an asset lineage
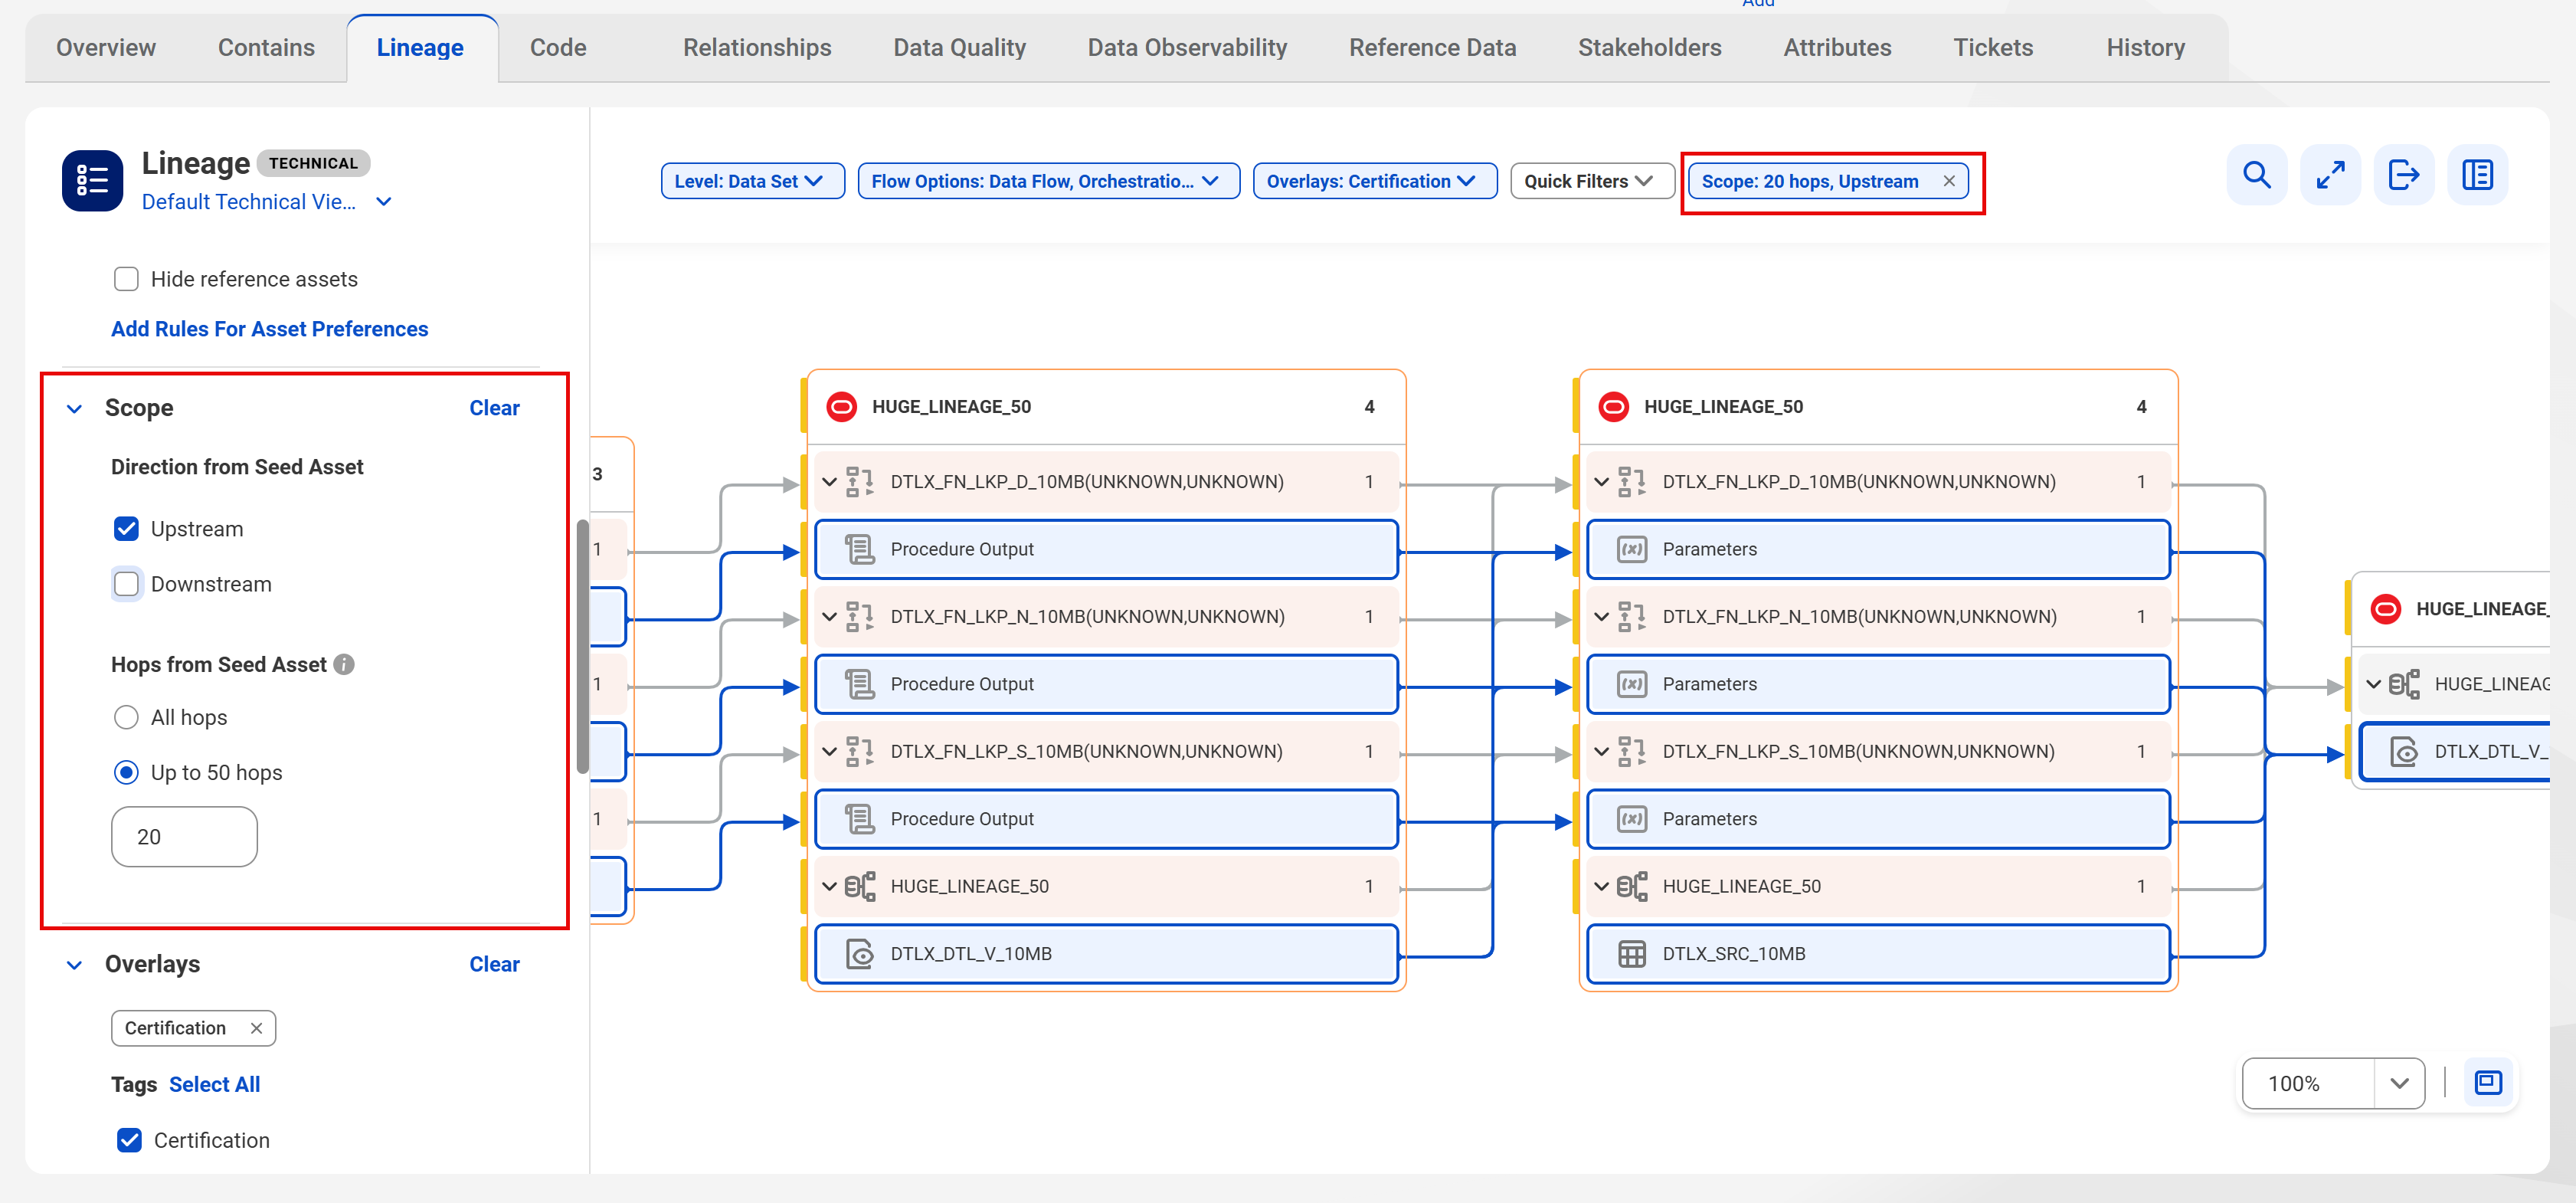
Use the options in Scope to control which portion of the lineage graph appears relative to the seed asset in the lineage. You can set the direction and depth of the lineage scope by configuring the following options:
•Direction from Seed Asset. Select Upstream, Downstream, or both to show the assets that feed into or receive data from the seed asset. If you don't select a direction, Data Governance and Catalog shows the lineage in both directions.
•Hops from Seed Asset. Select All hops to view a complete lineage, or select Up to and specify a number to limit the lineage hops from the seed asset. If you select All hops, some lineages might require you to expand upstream or downstream to see more hops.
The following image shows Scope in Manage Configuration and the scope overlay on the toolbar:
View flows on an asset lineage
You can view different flow lines in an asset's lineage that represent the conditions and processes that are applied on the data. For a particular data element, the direction of the flows is either unidirectional or bidirectional, depending on how one element communicates with the other.
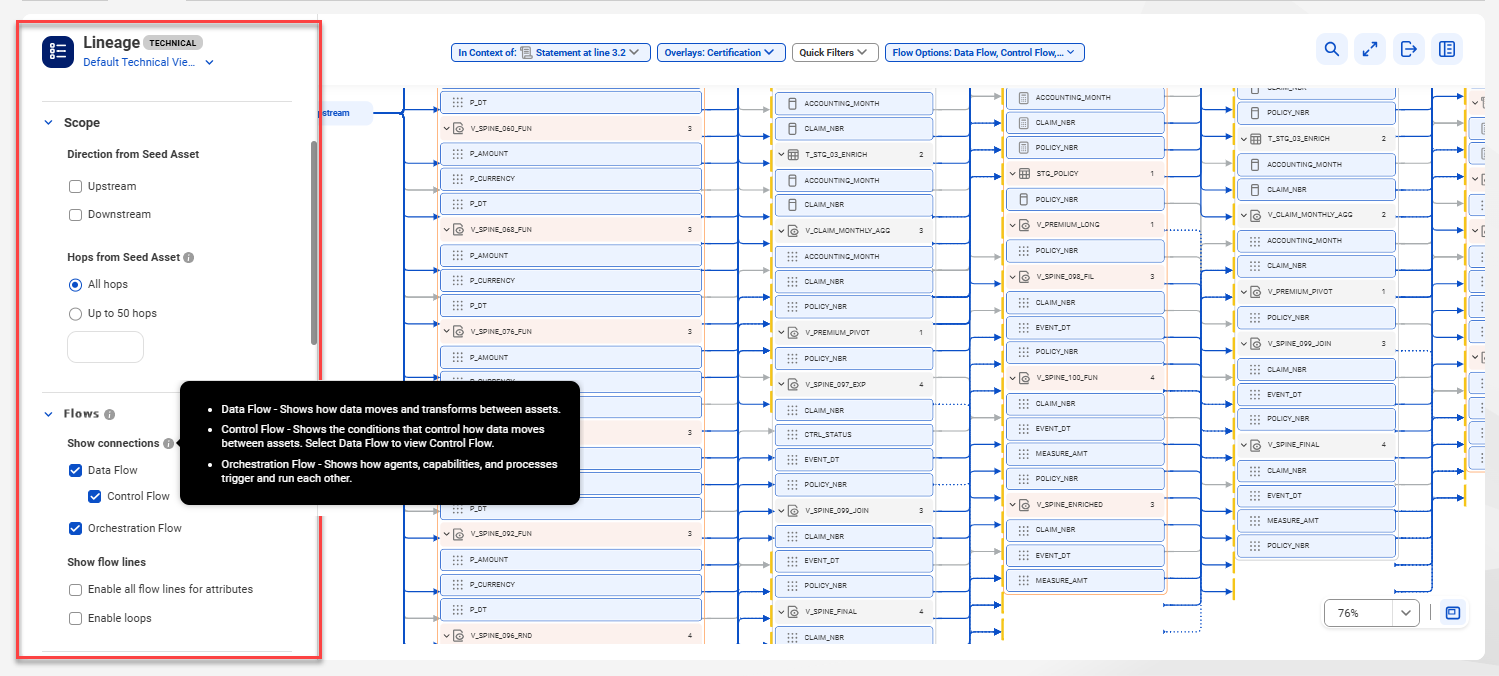
The following image shows the Manage Configuration menu for the Flows configuration:
For Flows, you can select the flows you want to see from the configuration menu or from the permanent overlay on the toolbar. Select from the following options:
•Data Flow. Shows how scanned data moves and transforms between assets. Data Governance and Catalog displays a solid line for data flow.
•Control Flow. Shows the conditions for data movement between a source asset and a target asset. For example, the source uses a WHERE clause, a JOIN condition, or a GROUP BY clause, without passing a data value to the target. Data Governance and Catalog displays a dashed line for a control data flow.
Note:
You must enable the Data Flow option to view the control flow between assets.
•Orchestration Flow. Shows how jobs, agents, tools, or processes trigger and run each other. Data Governance and Catalog displays an orange dotted line for orchestration flow.
•All flow lines. View data flow across all data elements in the lineage.
•Loops. Removes repeated assets and repeated paths in the data flow so that you can see the relationships in loops in the lineage. This option shows cyclic relationships and repeated paths within the data flow.
The following image shows the permanent data flow overlay for a lineage:
Add business and technical context through overlays
Apply overlays to add business and technical context to the assets in an asset lineage. Overlays are grouped into different categories, such as Data Classification, Glossary, Business Impact, Data Quality, and Tags. The Glossary, Business Impact and Data Quality overlays are displayed as individual groups on the lineage. The overlays in the Tags category are displayed as inline overlays within each asset node.
When you apply the Business Term or Metric overlay, you can identify assets that are critical data elements by the Critical Data Element (CDE) icon. The icon appears next to the assets in the lineage. In the overlay, all glossaries containing CDEs appear first, followed by non-CDE glossaries. Within each category, the glossaries are sorted alphabetically.
If the Data Marketplace Administrator has connected Data Marketplace to Data Governance and Catalog, the Overlays menu displays the Data Marketplace overlay. You can use the Data Marketplace overlay to see the assets that are added to one or more data collections in Data Marketplace, including the assets that are added to unpublished data collections.
If you select options for the Data Classifications overlay, the classified assets appear highlighted in the lineage. The lineage graph also shows a Data Classification overlay that shows details of the data entity or element classifcation, and the classification category.
You can also apply the Sensitivity overlay to display icons depicting the sensitivity of data elements on the asset node. The color of the sensitivity icon varies based on the sensitivity level.