You can drill down into an asset's lineage to view details of its transformation. This lineage shows the data transformation logic applied on the asset and includes the conditions, expressions, and flow lines that describe how the asset processes data.
Data Governance and Catalog shows a systematic representation of the metadata movement for an asset in its Transformation Details. The Transformation Details is an asset lineage view for a data element.
Within a transformation lineage view, you can view the connections between different processes and the logic that moves and changes data for an asset. From a general lineage, you can view the transformation details for an asset. Data Governance and Catalog builds these details from the metadata that a catalog source captures about an asset. These details include information such as a mapping, a query, or a stored procedure.
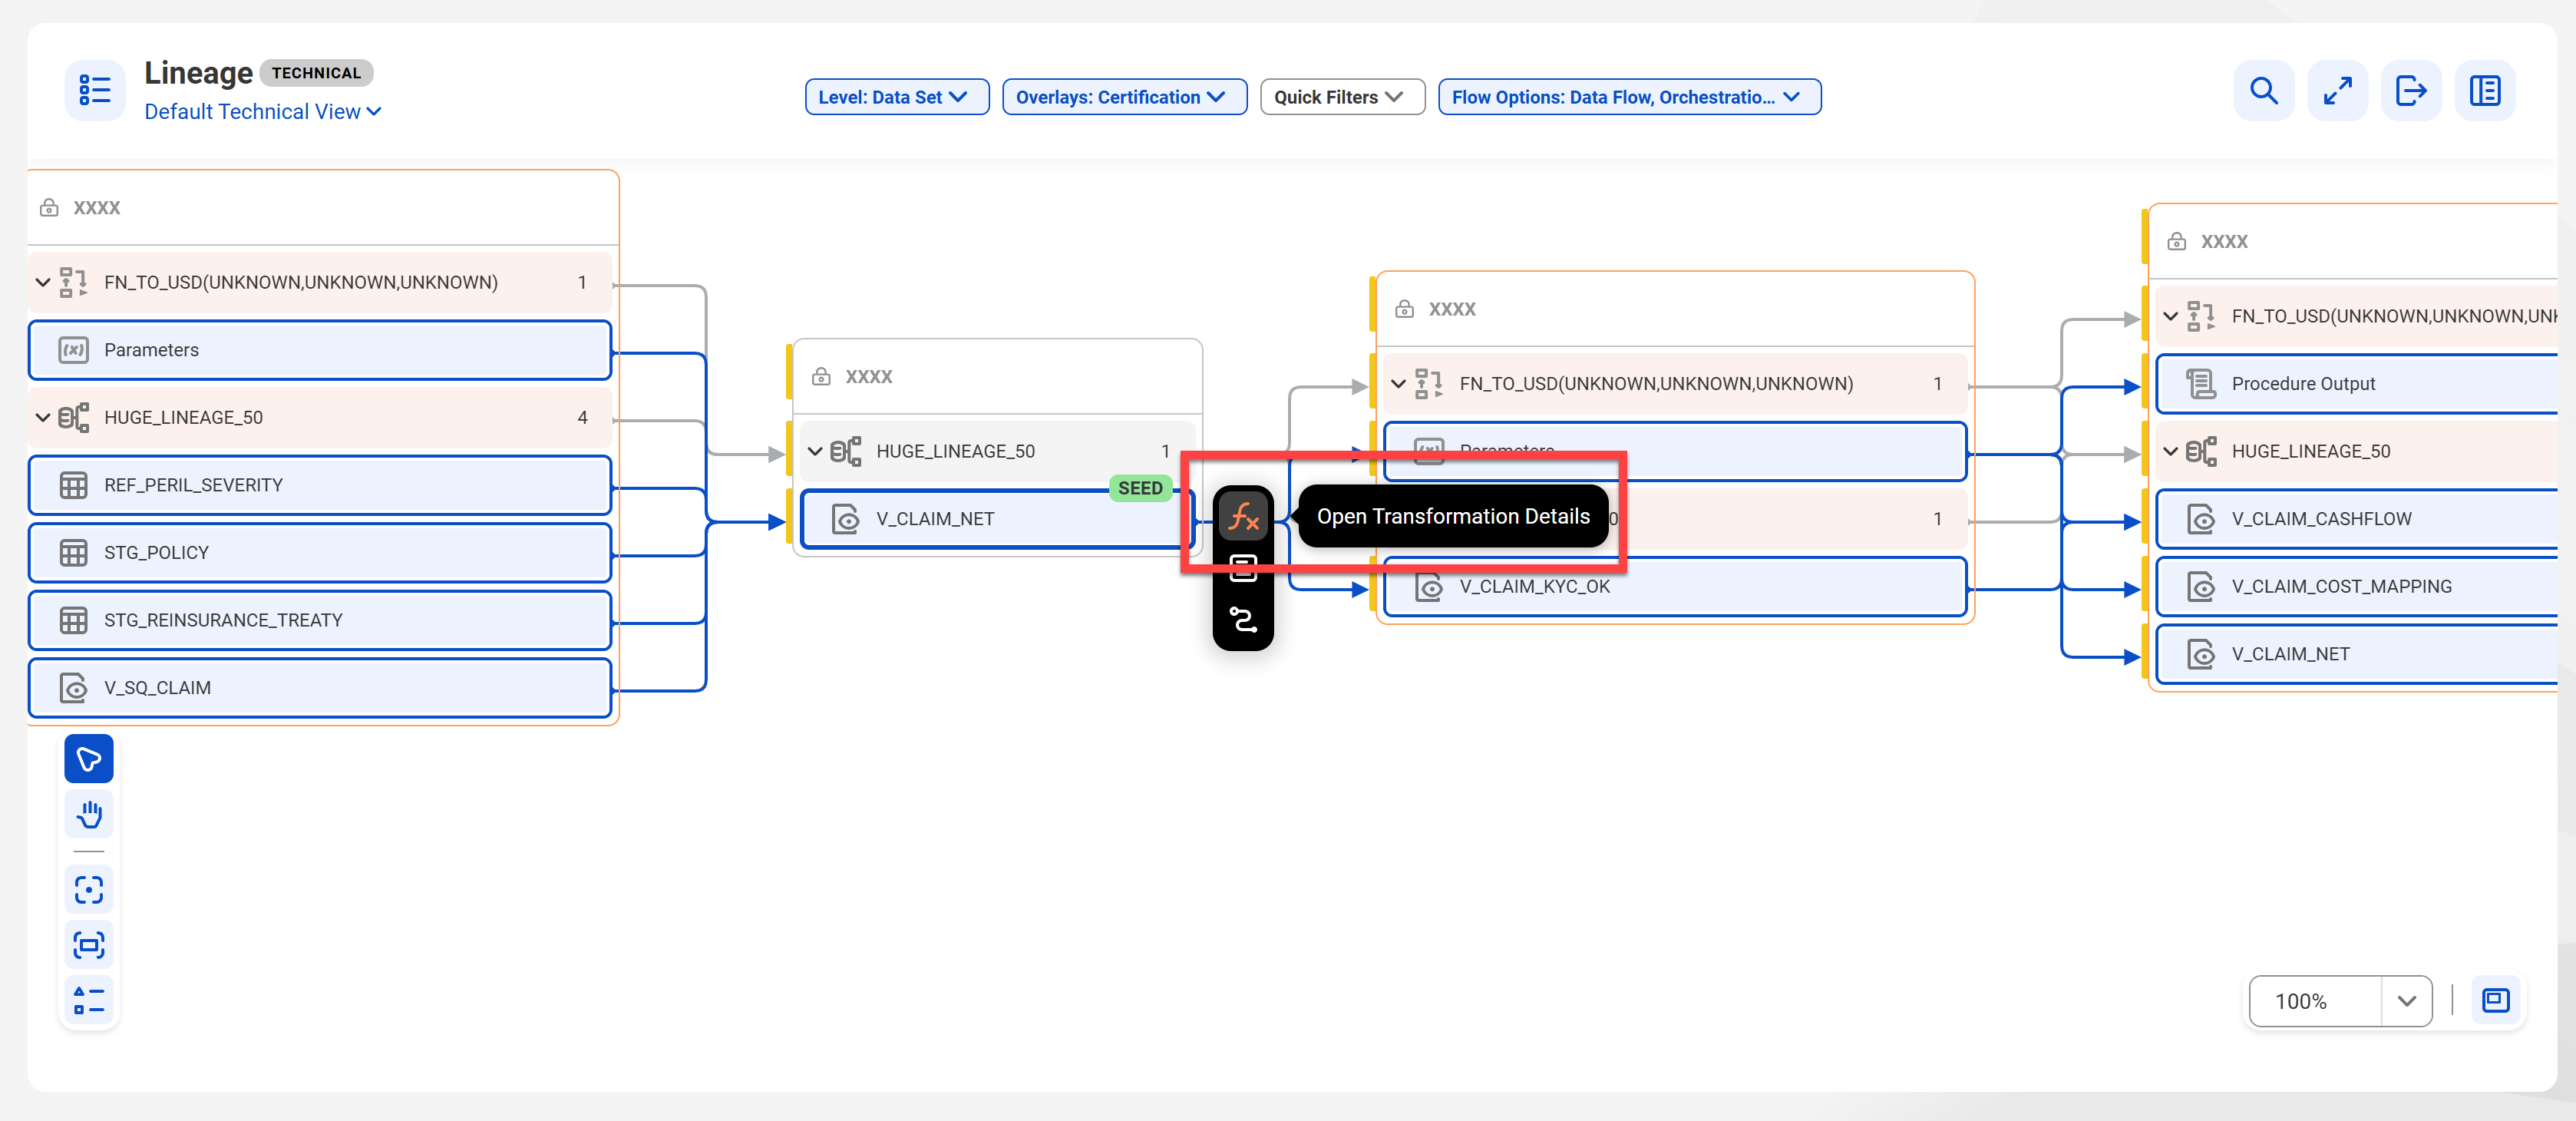
The following image shows the Open Transformation Details icon for an asset in a Data Governance and Catalog lineage:
View the Transformation Details canvas
On the Lineage tab of an asset page, click Open Transformation Details for an asset in the lineage canvas to view the Transformation Details canvas for the selected asset. On this canvas, you can view the transformation details for an asset as a lineage graph.
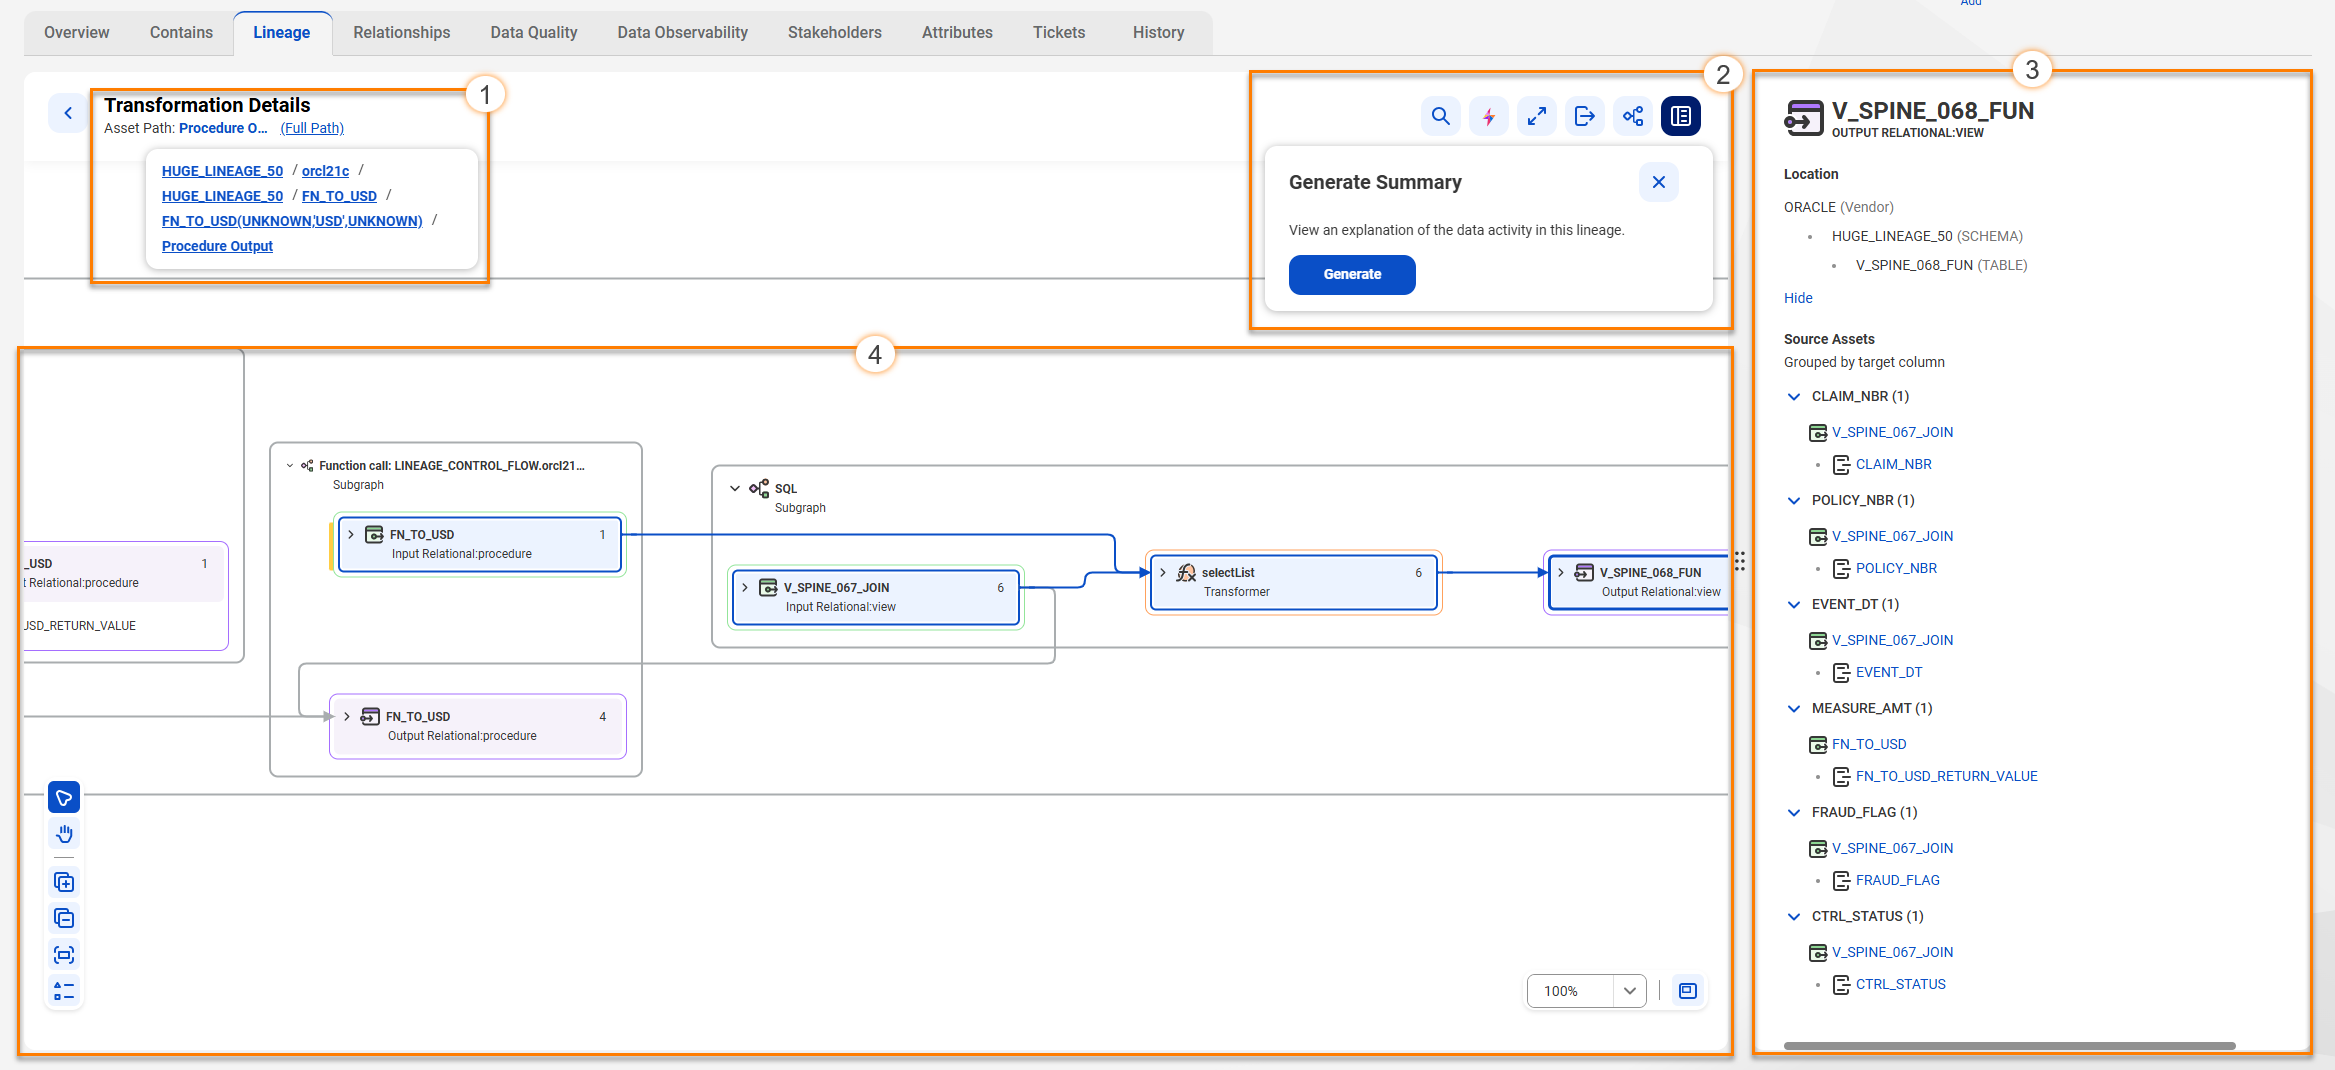
The following image shows the transformation details for an asset:
The transformation details include the following components:
1Transformation Details header. View the asset name for which the transformation is displayed. Click Full Path to view the hierarchical path of the asset.
2Transformation details toolbar. Click the icons in the toolbar to perform the following activities:
- Find. Open the Find bar. You can enter asset names to locate them in the transformation canvas.
- Generate Summary. Open the Generate Summary message box and generate an AI-written summary of the transformation logic for the asset. Data Governance and Catalog generates the summary from metadata in your catalog sources, which you can copy and use for different requirements. To enable Generate Summary, an administrator requires to select Enable CLAIRE Generative AI Services on the Settings page in Administrator.
- Full Screen. View the lineage in full screen.
- Export. Export the current lineage as a PNG, PDF, or SVG file.
- Data Input and Output. Open a panel that lists the input and output occurrences for a selected asset in the transformation or for the whole transformation. For each input or output in the transformation, you can view parent assets along with the assets that the input feeds into or the assets produced by the output.
- Show Details. Toggle the preview pane on the right to display more details about the selected asset in the transformation. The preview pane shows a structural representation of the asset's location in the catalog. It also shows the selected asset's data type, an expression you can copy, and the assets that contribute to the selected asset.
3Side panel. Displays the Data Input and Output or Show Preview panels when you click their corresponding icons on the toolbar or on the canvas.
4Transformation interface canvas. Displays the visualization for a selected asset's transformation details. On a transformation canvas, you can view a detailed graph of the logic that is applied on your metadata. When you open a transformation view, you might see the seed asset with a few transformation details. You can click on different assets in the canvas to expand the graph and view more details of the transformation. By default, control flows appear between every input and output data for an asset's transformation details.
You can perform some of the activities that appear on a general lineage such as Select and Pan Mode, Fit Screen and Show Legend. You can also perform the following activities on a transformation canvas:
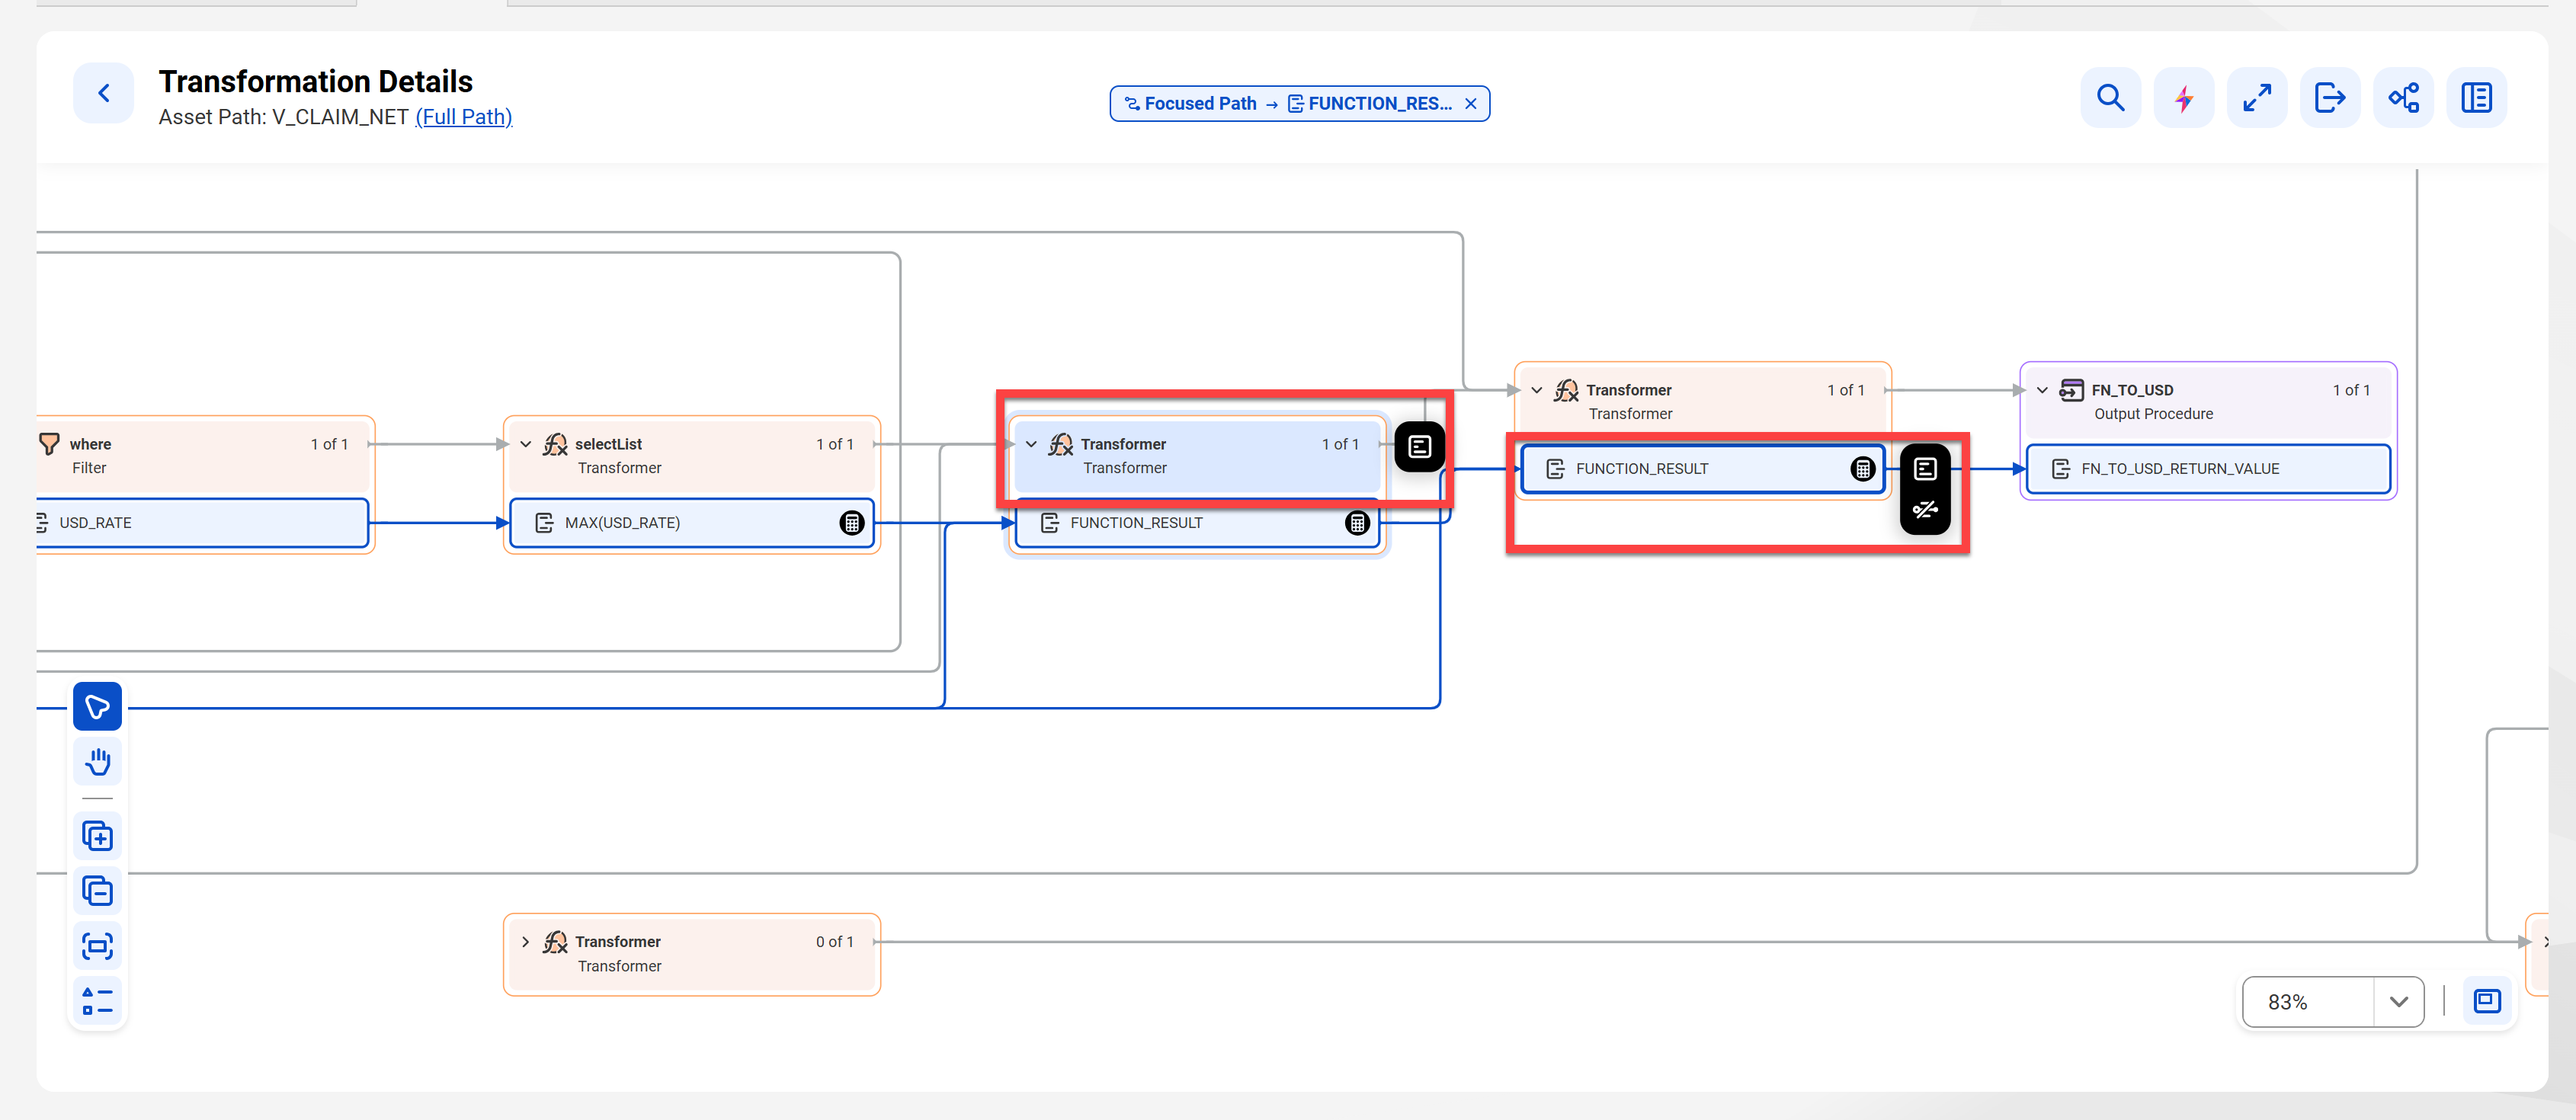
- Focus Path. When you hover over an asset, click Focus Path to view the transformation path for a selected data element. The focused path highlights the elements upstream and downstream from the selected asset. Data Governance and Catalog also opens a preview panel for the focused path. While a focused path is active, you can also interact with assets that are inside or outside it. Hover over an asset and click Show Details to toggle its side panel for the asset.
- Expand and Collapse All Nodes. If you want to view the transformation details in its entirety, click Expand All Nodes. This action expands the nodes in the transformation graph and reveals the different data sources that are part of the transformation. If you want to revert the transformation graph to show only the seed asset, click Collapse All Nodes.
The following image shows a data element's focused path and the actions you can perform in an asset's transformation details: