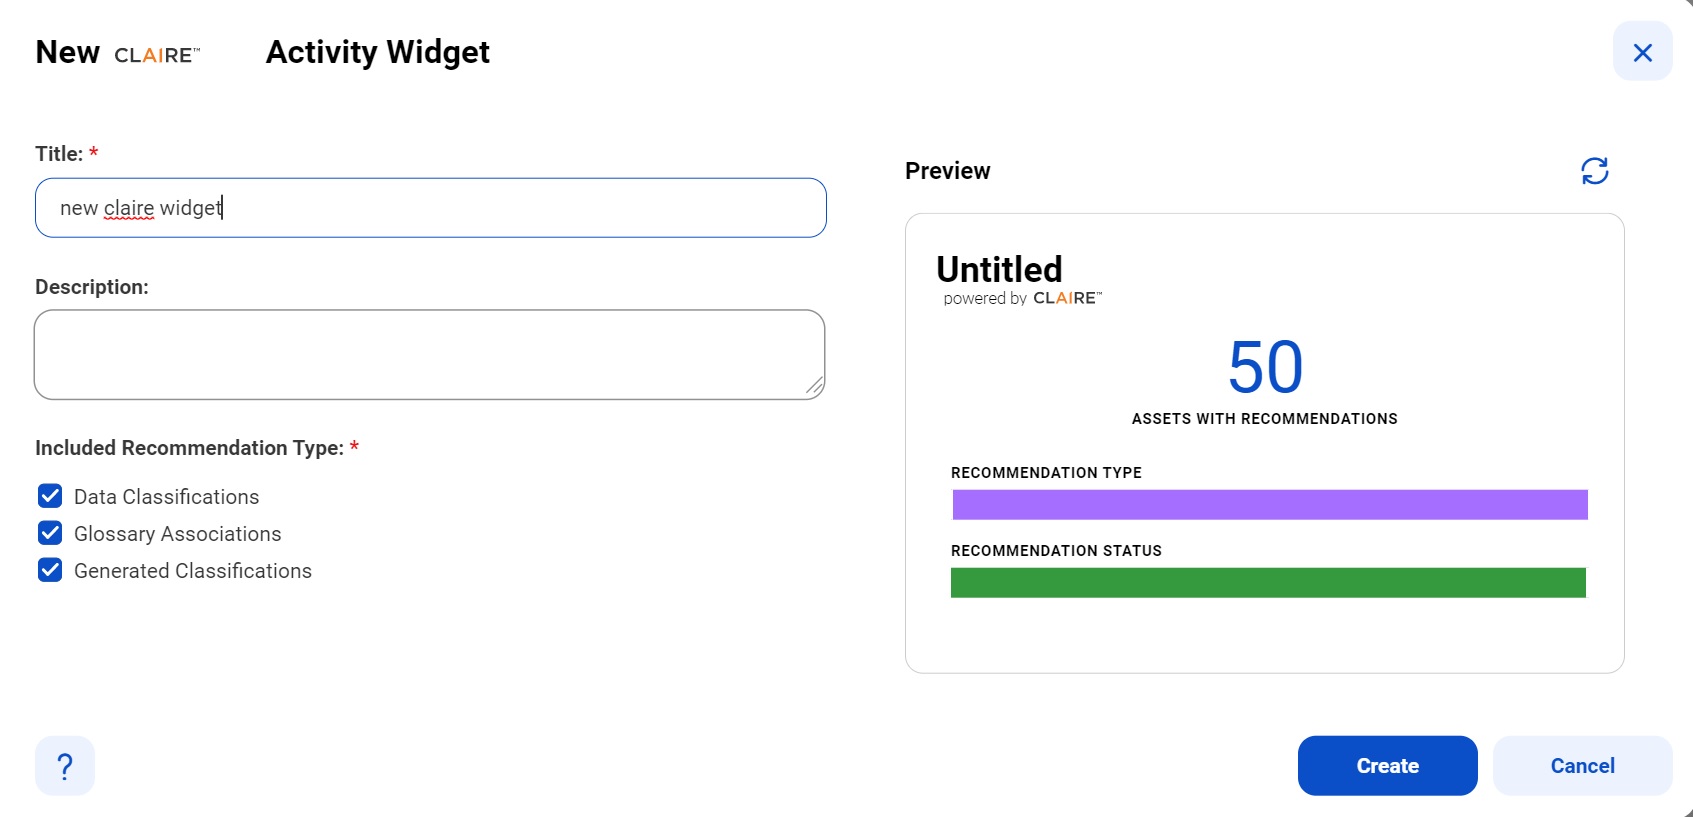
Field | Description |
|---|---|
Title | Enter the title of the widget as you want it to appear on the home page dashboard. |
Description | Enter a description for the widget. |
Included Recommendation Type | Select the type of association from the following list for which you want to see the widget information:
|
Preview | Click Show Preview to see a preview of the widget. |
Refresh | Click the refresh icon to preview the latest information about the widget. |

Field | Description |
|---|---|
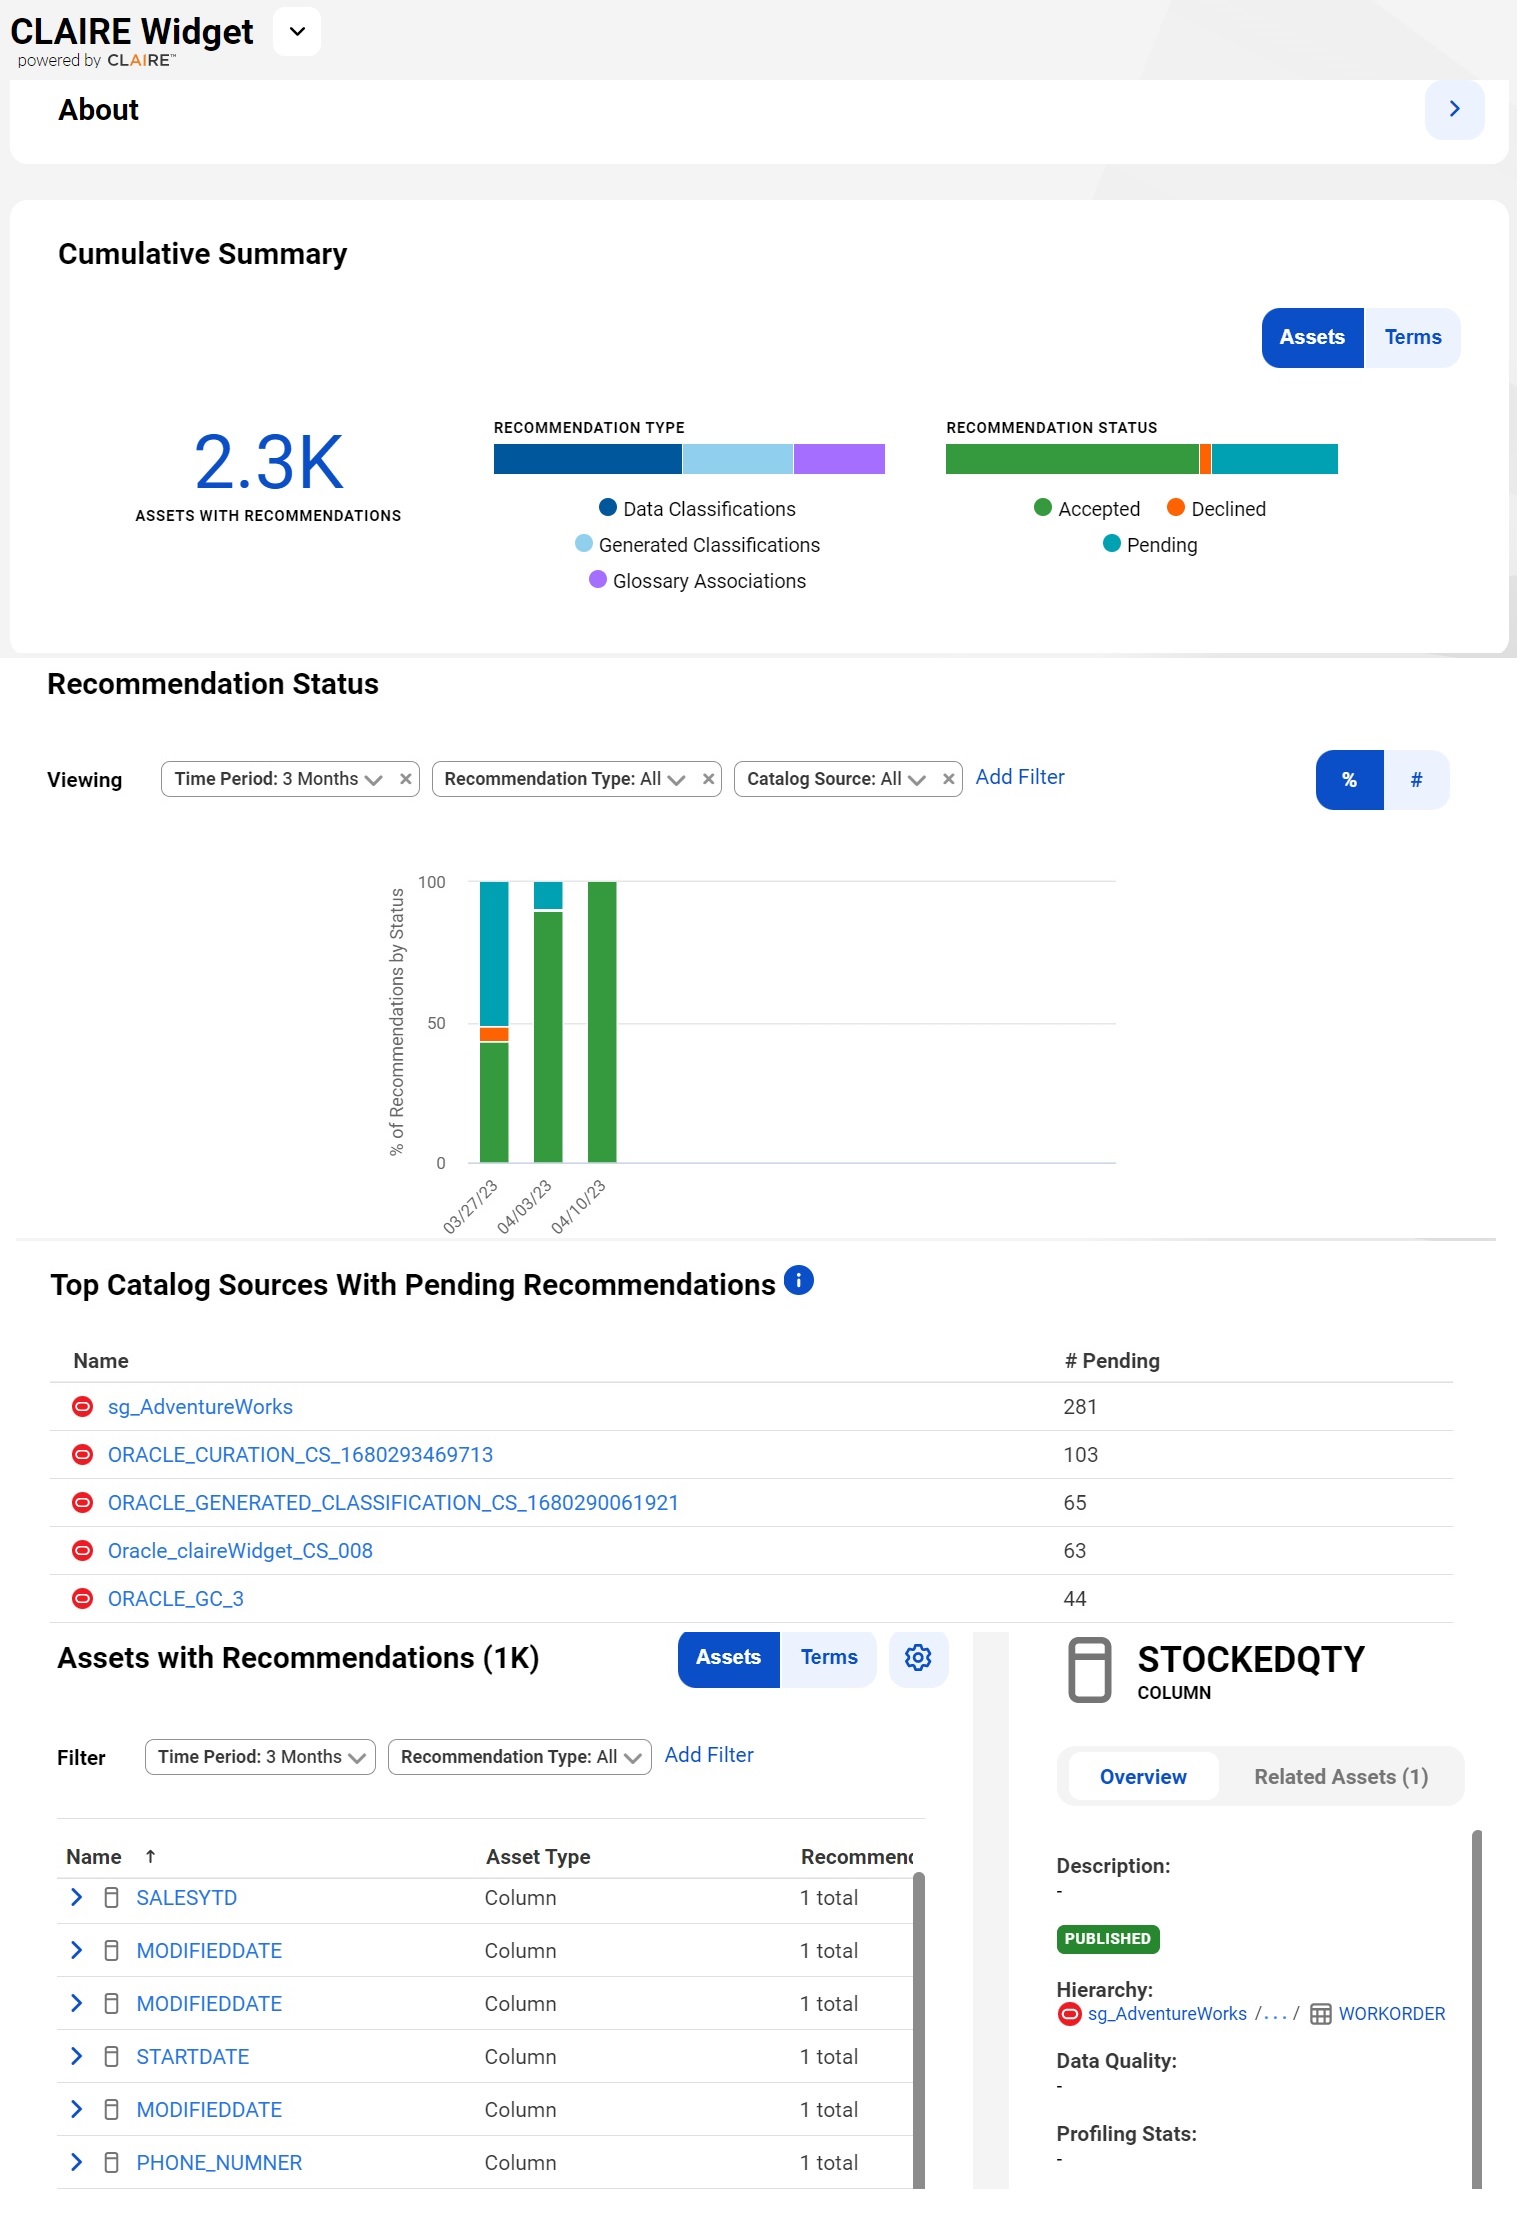
About | Displays the created and updated dates of the CLAIRE dashboard page. |
Cumulative Summary | Displays the overall summary of the assets and terms with recommendations:
|
Recommended Status | Displays the accepted, declined and pending recommendation status of the associated assets. You can filter the view according to the time period, recommendation type, catalog source, and status. For generated classifications recommendation type, you can view the top five catalog sources associated with the pending generated classifications on the preview pane. Note: You can only view declined and pending status of the generated classifications. |
Top Catalog Sources with pending Recommendations | Displays the top five catalog sources associated with the pending generated classifications and glossary terms. |
Assets with Recommendations | For the associated recommended assets, displays the name, asset type, recommendation, recommendation type, and the status. You can filter the view according to the time period, recommendation type, status, and catalog source. |
Recommended Terms | Displays the recommended terms, recommendation types, associated catalog sources, and the associated assets for the recommended glossary terms, generated classifications, and data classifications. You can filter the view according to the time period, recommendation type, associated catalog source, and associated assets. |
Field | Description |
|---|---|
Title | The title of the widget as you want it to appear on the home page dashboard. |
Description | A description for the widget. |
Select Metric | A metric for the data you want to show on the widget. |
Select Filters | A filter to apply on the metric data. |
Select Asset Type:
| The asset types to display on the widget. |
Select Catalog Source Type | One or more catalog sources for which you want to view and evaluate the identified anomalies. |
Set Default View | Select a filter to apply by default when the widget loads. |
Preview | A preview of the widget. The preview is based on the properties you have configured and the visualization options you have selected. |


Field | Description |
|---|---|
Title | The title of the widget as you want it to appear on the home page dashboard. |
Description | A description for the widget. |
Preview | A preview of the widget. The preview is based on the properties you have configured and the visualization options you have selected. |


Field | Description |
|---|---|
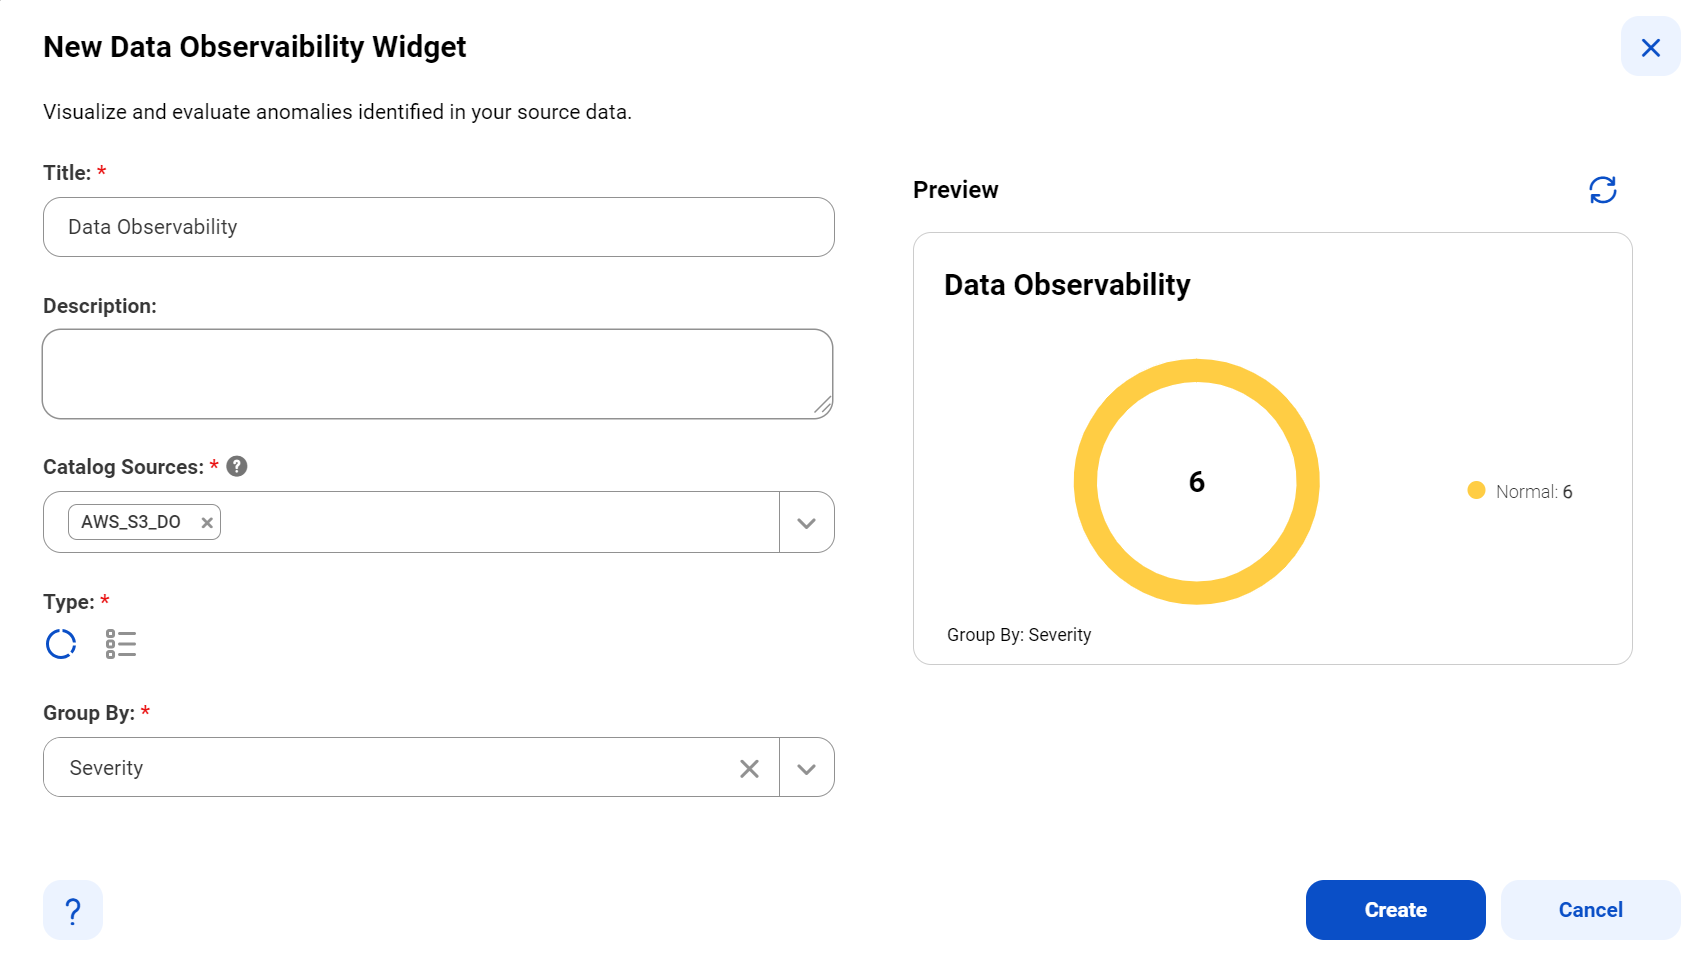
Title | Enter the title of the widget as you want it to appear on the home page dashboard. |
Description | Enter a description for the widget. |
Catalog Sources | Choose one or more catalog sources for which you want to view and evaluate the identified anomalies. |
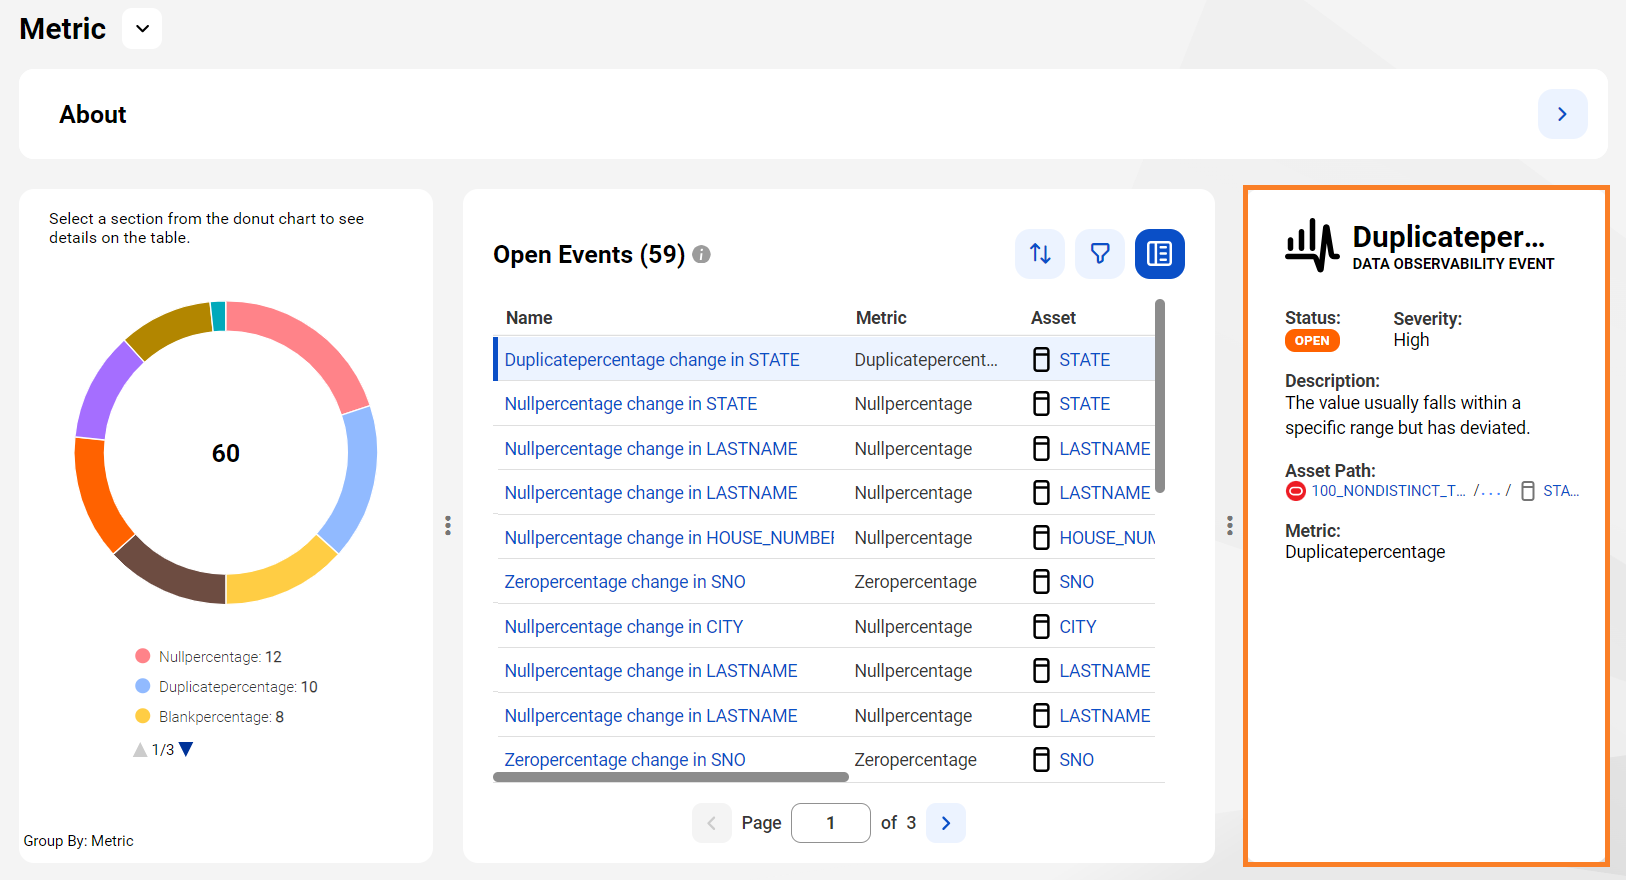
Type | Specify whether you want the data observability widget to appear as a donut chart or list widget type. |
Group By | Select the criteria by which you want to categorize the open events for the asset. You can categorize the open events for the asset based on severity or metric. |
Preview | Click Show Preview to see a preview of the widget. The preview is based on the properties you have configured and the visualization options you have selected. |
Field | Description |
|---|---|
Title | Enter the title of the widget as you want it to appear on the home page dashboard. |
Description | Enter a description for the widget. |
Select | Select the data for which you want to view the data quality scores. You can choose one of the following options:
For more information about search queries that you can enter, see Search query examples. |
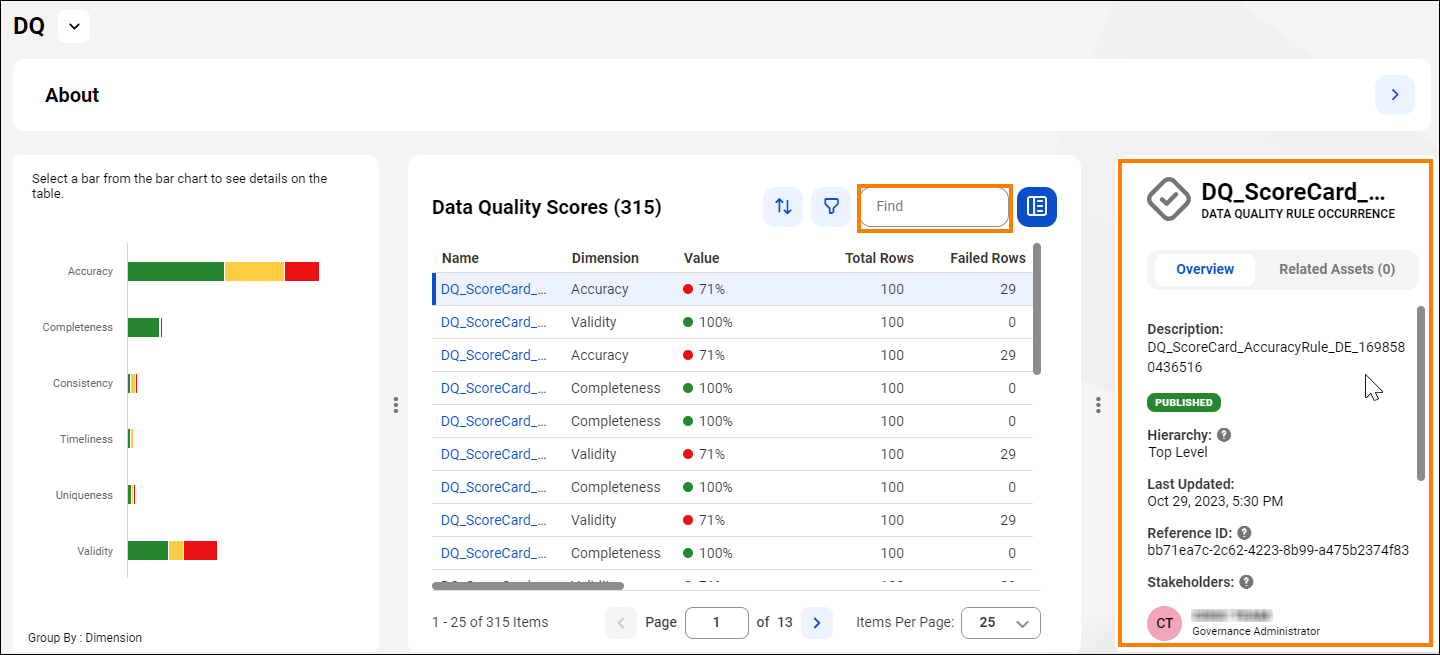
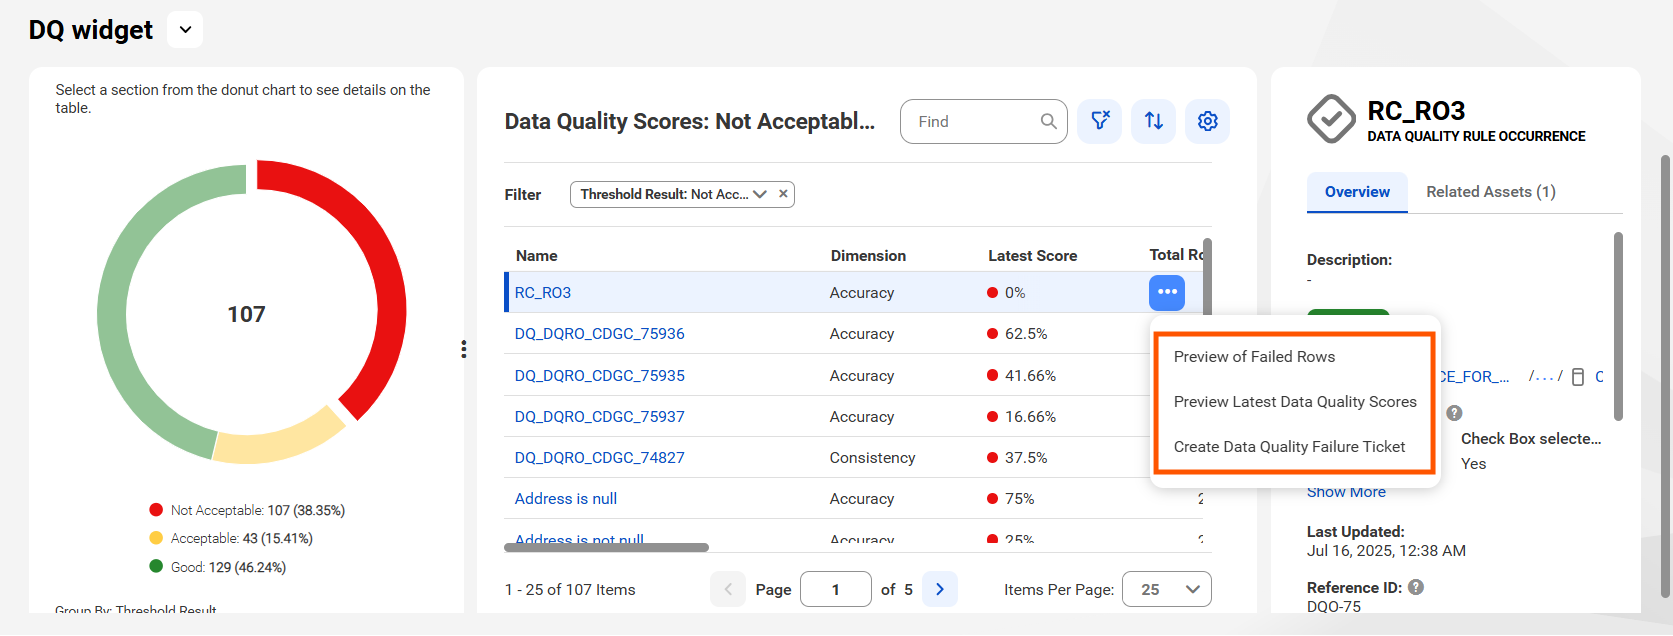
Type | Specify whether you want the data quality widget to appear as a donut chart, bar chart, or score chart widget type. |
Preview | Click Show Preview to see a preview of the widget. The preview is based on the properties you have configured and the visualization options you have selected. |
Refresh | Click the refresh icon to preview the latest information about the widget. |
Field | Description |
|---|---|
Title | Enter the title of the widget as you want it to appear on the home page dashboard. |
Description | Enter a description for the widget. |
Job | View information for all jobs that you have triggered. You cannot alter the type of jobs. |
Period | View jobs information for the entire period. You cannot alter the period. |
Refresh Interval | The widget lets you run a manual refresh to retrieve the latest jobs data. You cannot alter the refresh interval. |
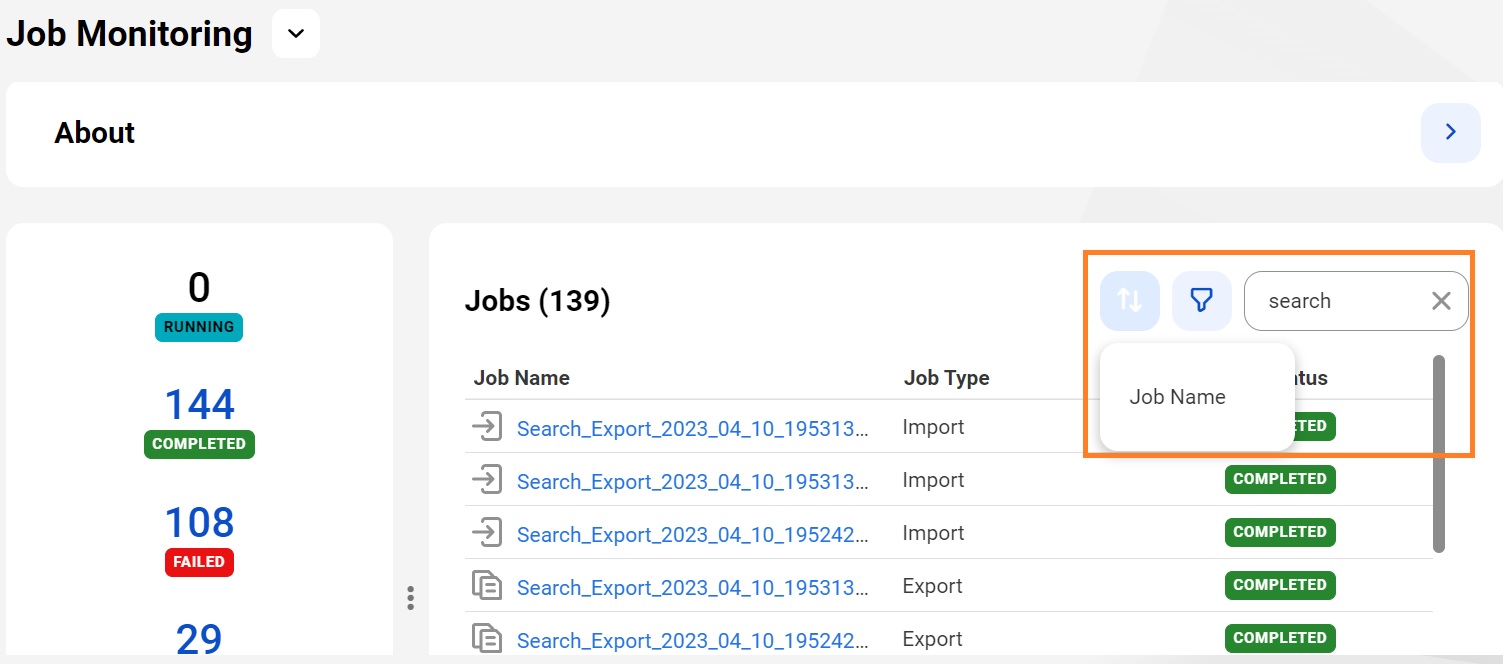
Type | Specify whether you want the job monitoring widget to appear as a count or list widget type. You can specify the number of rows you want to display on the Preview section and the Dashboards page for list widget type. Optionally, click View All to view all the displayed rows for the widget on the Dashboards page. |
Preview | Click Show Preview to see a preview of the widget. The preview is based on the properties you have configured and the visualization options you have selected. |
Refresh | Click the refresh icon to preview the latest information about the widget. |
Field | Description |
|---|---|
Title | Enter the title of the widget as you want it to appear on the home page dashboard. |
Content | Enter the text that you want to display in the widget. Use the formatting options to add rich text formatting to the text. |
Preview | Click Show Preview to see a preview of the widget. |
Refresh | Click the refresh icon to preview the latest information about the widget. |
Field | Description |
|---|---|
Title | Enter the title of the widget as you want it to appear on the home page dashboard. |
Description | Enter a description for the widget. |
Select | Select a saved search or enter a new search criteria. You can choose from the following options:
|
Select Asset Types | Select the asset types on which you want to run the search criteria. The search-based widget displays the assets that match the search criteria. |
Type | Specify how you want to display the search results on the widget. You can choose one of the following types:
|
Rows to Display | Choose the number of asset rows that you want the List widget to display. This field is applicable only for the List widget type. |
Select Display Columns | Select the attributes of the searched assets that you want the List widget to display as columns. This field is applicable only for the List widget type. |
Group By | Select the criteria by which you want to categorize the searched assets. This field is applicable for the Count, Bar chart, and Donut chart widget types. |
Preview | Click Show Preview to see a preview of the widget type that you have selected. |
Refresh | If you have modified the search settings, click the refresh icon to preview the latest information in the widget. |
Field | Description |
|---|---|
Title | Enter the title of the widget as you want it to appear on the home page dashboard. |
Description | Enter a description for the widget. |
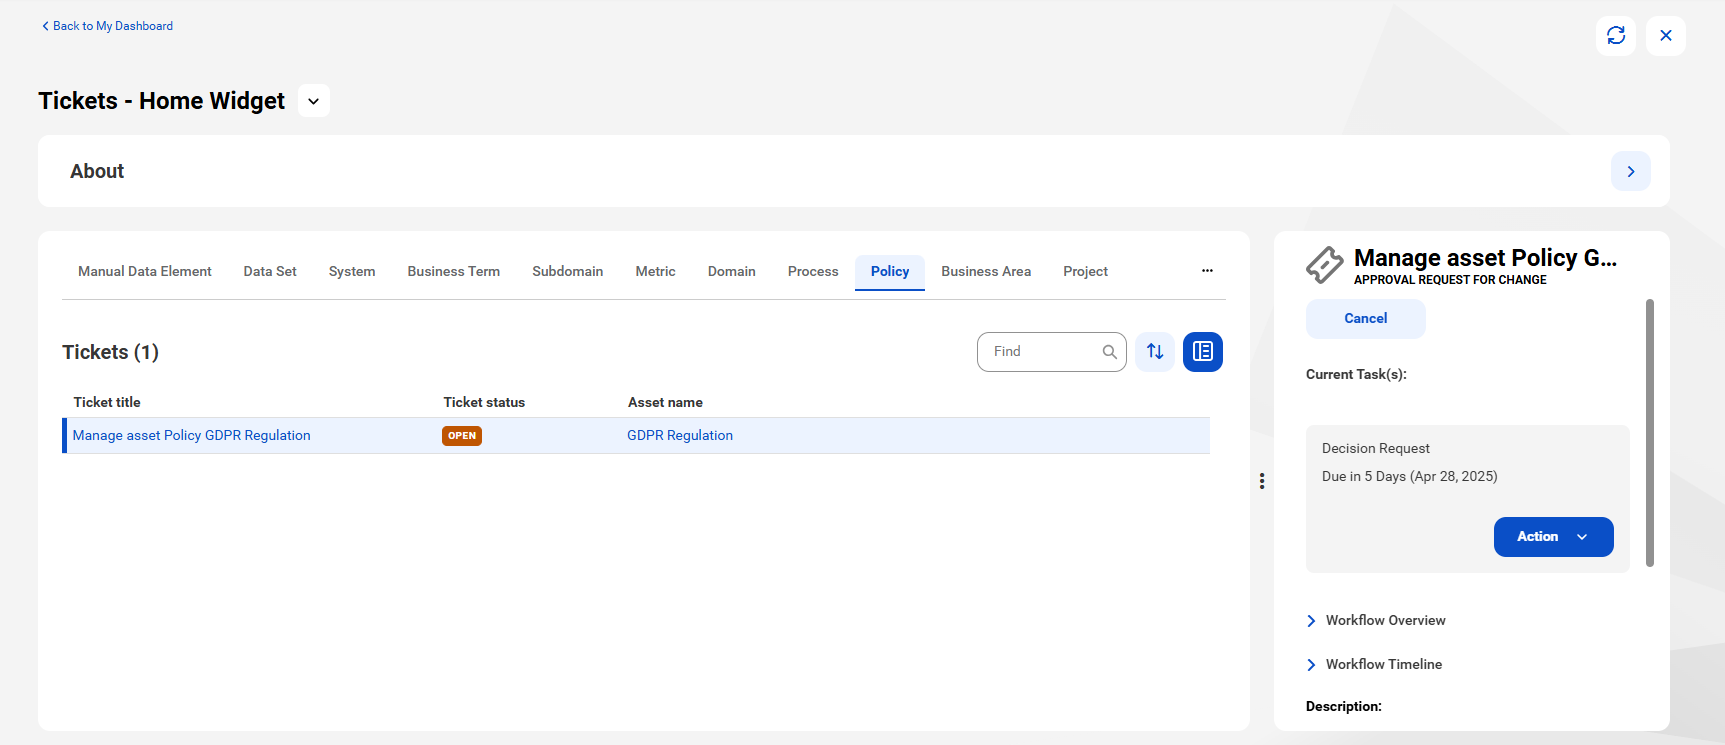
Search Criteria | Enter search terms to find assets that have ticket workflows. You can enter * to search for all assets. Data Governance and Catalog displays all assets for the asset type that you specify in the Select Asset Types field. If you know the name of a ticket, enter the ticket name in full or part to create a widget for the ticket. |
Select Asset Types | Select the asset types for which you want to monitor the tickets. If you entered search terms in the Search Criteria field, the Select Asset Types field displays the count for matching entries for each asset type. |
Type | Specify whether you want the tickets widget to appear as a list, count, or donut chart widget type. You can specify the number of rows you want to display on the Preview section and the Dashboards page for list widget type. Optionally, click View All to view all the displayed rows for the widget on the Dashboards page. |
Select Display Columns | For list widget type, select the list of options from the drop-down list for which you want to see the data in the widget. |
Group By | For count and donut chart widget types, select the list of options from the drop-down list for which you want to see the data in the widget. |
Tickets Created in | Select the period for which you want to see the tickets. |
Tickets status | Select the Show tickets that are in progress check box, to display the tickets that are in progress and to exclude the completed tickets in the widget. |
Users or User Groups | Click Add to select the users or user groups that created the tickets you want to monitor. Select the Include current user check box to include yourself among the other stakeholders that have created the tickets. |
Stakeholders | Select one of the options to group the widget information based on the stakeholders that have created the tickets or assigned as stakeholders in the tickets. |
Preview | Click Show Preview to see a preview of the widget. The preview is based on the properties you have configured and the visualization options you have selected. |
Refresh | Click the refresh icon to preview the latest information about the widget. |
