The Home page is your entry to Data Governance and Catalog. You can start by searching for a specific asset, browsing the assets by their types, or monitoring the widgets to see the most important information that is relevant for you. You can also view your notifications so that you can take relevant actions.
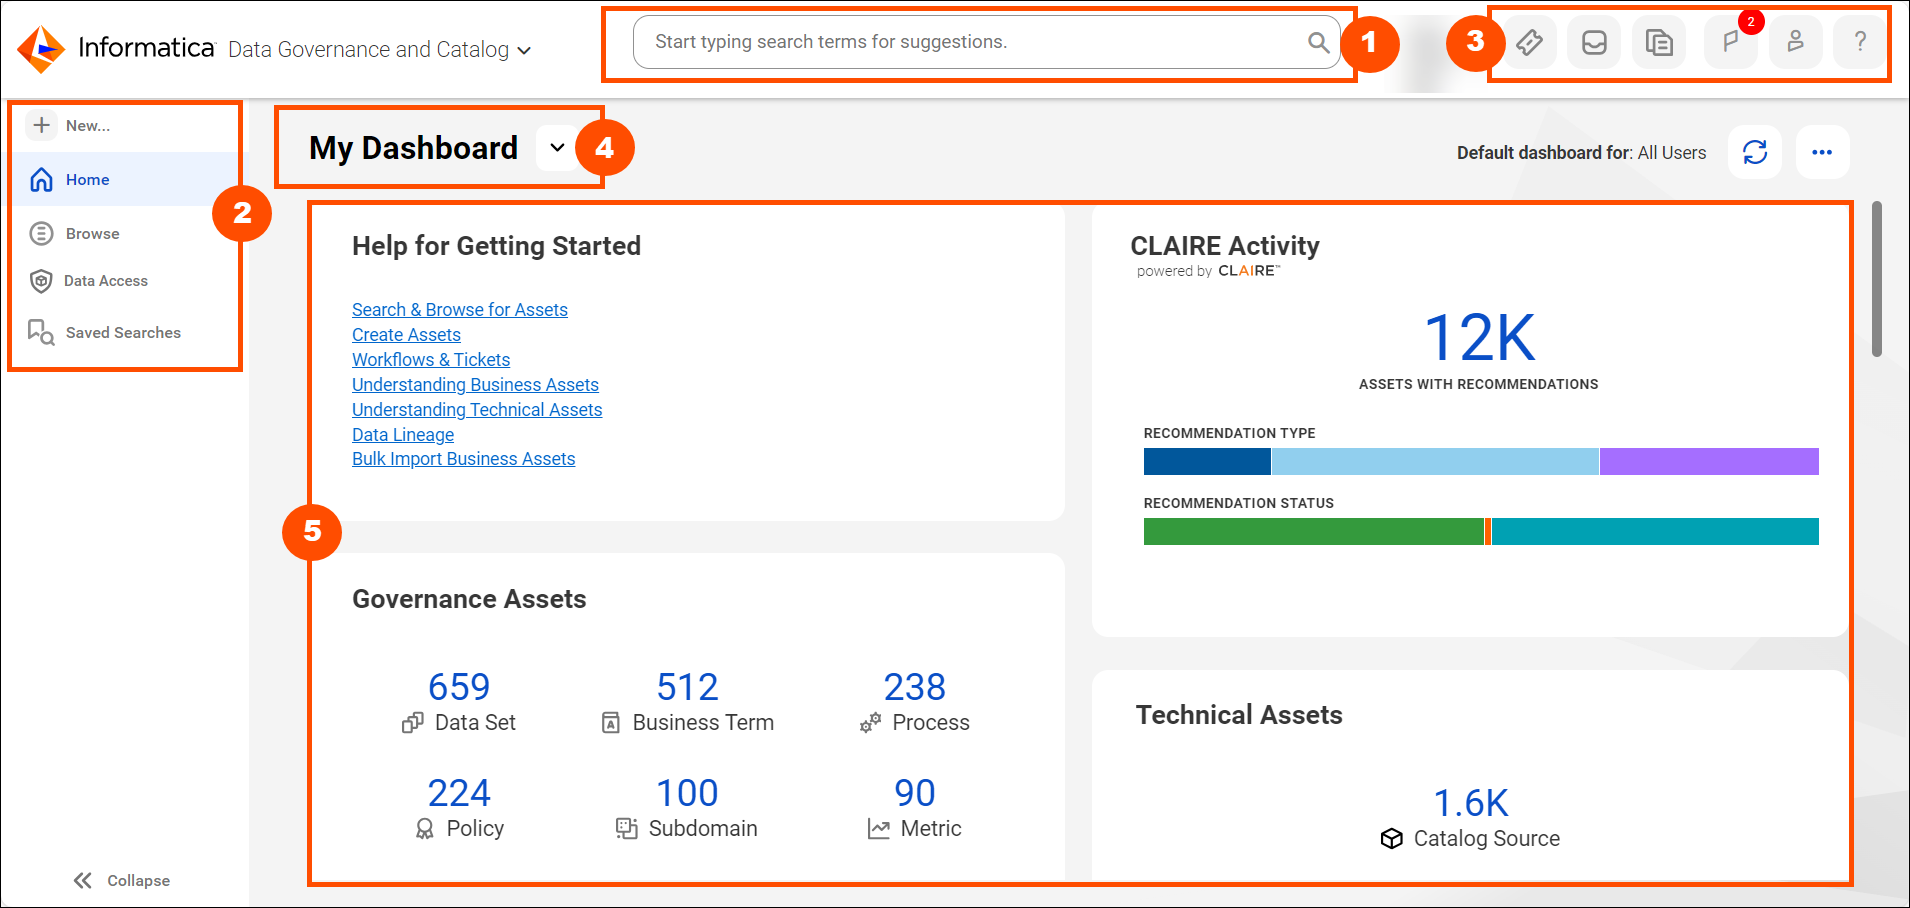
The following image shows an example home page with multiple widgets and dashboards:
1Search box. Search for technical or business assets using keywords or queries.
2Collapsible panel. Create or import new business assets, open Home page, browse by asset type, and view your saved searches.
The following table describes the icons that appear on the side panel in Data Governance and Catalog:
Icon
Description
New. Select the business asset type that you want to create, import assets and download the import template, and create a ticket to use a workflow when you create or modify an asset.
Home. Go to the home page.
Browse. Browse business and technical assets.
Data Access. Go to the Data Access Management page, which you use to manage data access policies to control access to your data and protect it.
Saved Searches. View all the searches you saved, shared with others in your organization, and the saved searches that others shared with you.
3Header. Other tasks such as ticket workflows, monitoring jobs, viewing notifications, and user settings that are associated with governance activities.
The following table describes the icons that appear on the header in Data Governance and Catalog :
Icon
Description
Ticket Manager. View running and completed workflow tickets to create or modify assets.
Workflow Inbox. View your ongoing and completed tasks.
Job Monitoring. View current and completed jobs.
Notification. View all notifications of the system.
User Settings. View user profile, user settings, and log out.
4Dashboards. Create one or more dashboards according to various governance or cataloging themes, and add appropriate widgets in each dashboard. You can share dashboards with others in your organization. For example, you can have a dashboard for all policy-related activities in your organization. Another dashboard to monitor the inflow of assets and jobs in the system and another dashboard to highlight people and their activities.
5Widgets. A widget is a snapshot of assets, jobs, or search queries that are important for your governance or cataloging activities. You can add multiple widgets to a dashboard and customize how you want your widgets to appear.