Monitoring MCP Servers
You can monitor the MCP servers that are running or have run in your organization.
To monitor jobs, your user role must have the View MCP Monitoring feature privilege for AI Agent Engineering.
The following image shows the
Monitor page:
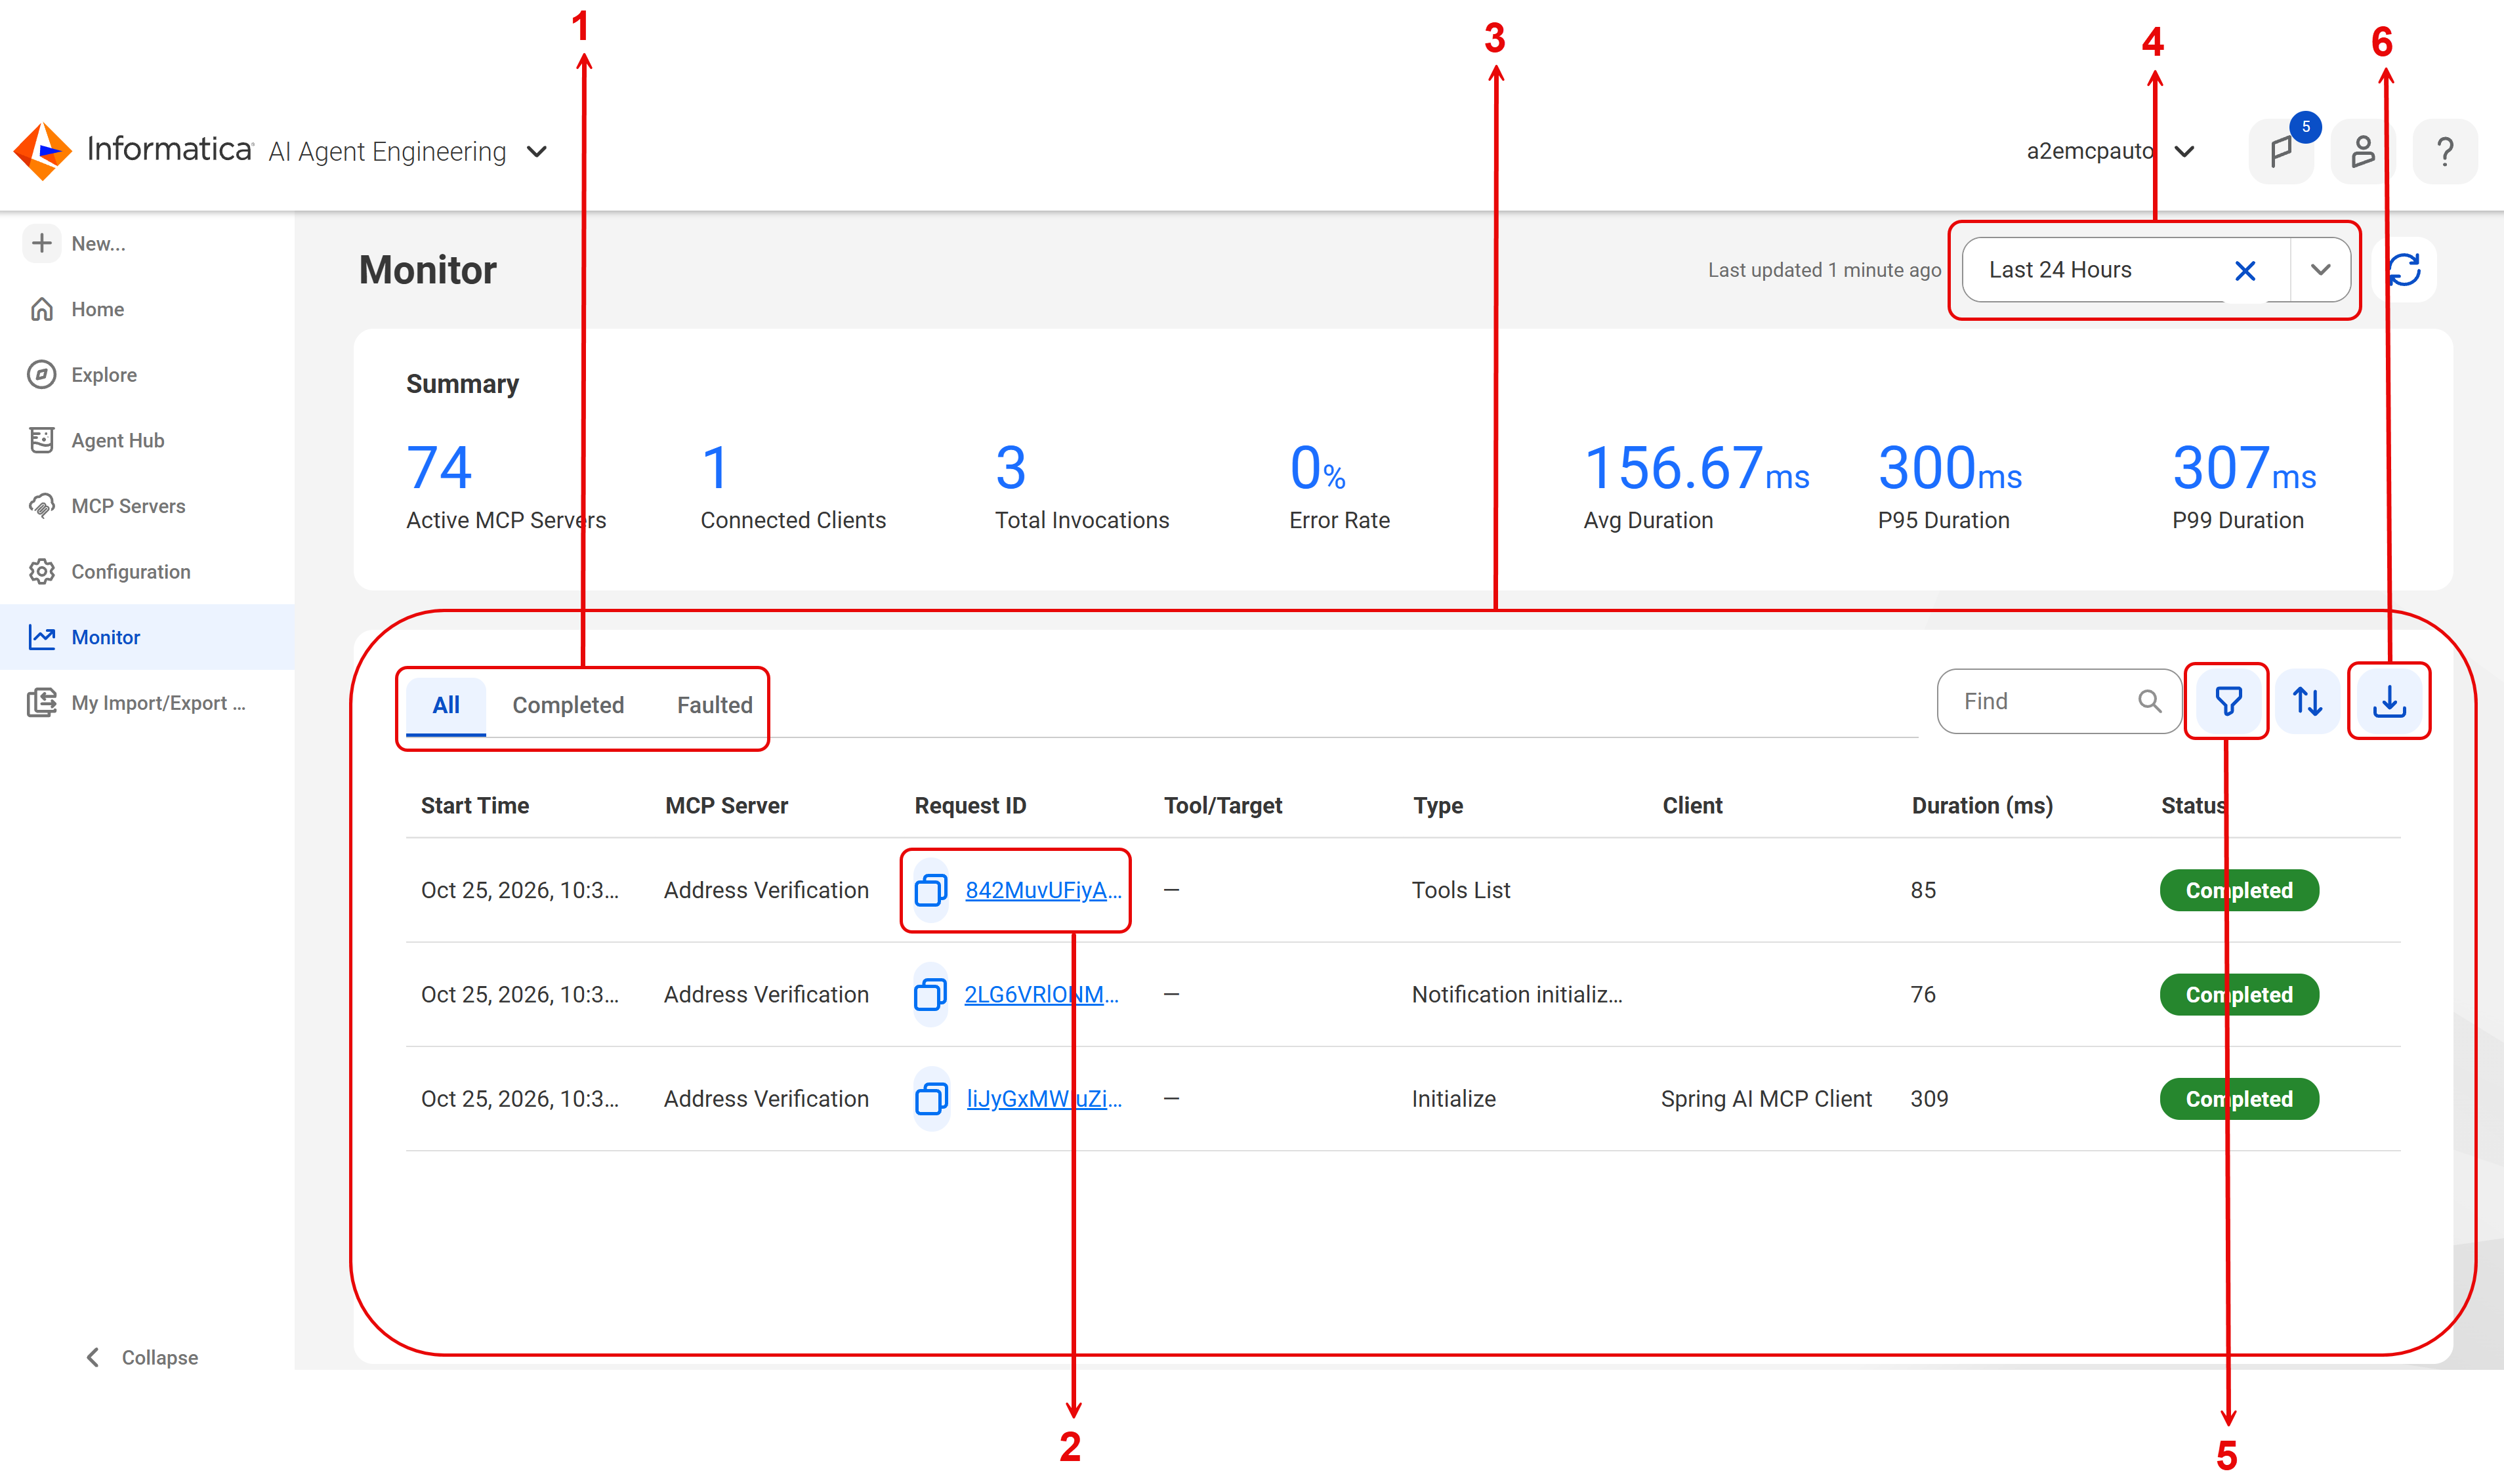
- 1View all, completed, or faulted invocations.
- 2Display invocation details for the request ID.
- 3View server activity in the details area
- 4Filter the page by the selected date range. Monitor shows up to 10,000 records and saves up to 90 days of server activity.
- 5Filter the displayed invocations.
- 6Download MCP server invocations as a CSV file.
The Summary dashboard shows an overview of your server activity in the past 24 hours, 7 days, 30 days, or within a custom date range.
In addition to active servers, clients, invocations, and error rates, the dashboard also displays the following information:
Metric | Description |
|---|
Avg Duration | Number of milliseconds it takes for the average invocation. |
P95 Duration | Number of milliseconds in which 95% of invocations finish. The remaining 5% take longer. |
P99 Duration | Number of milliseconds in which 99% of invocations finish. The remaining 1% take longer. |