
Metric | Description |
|---|---|
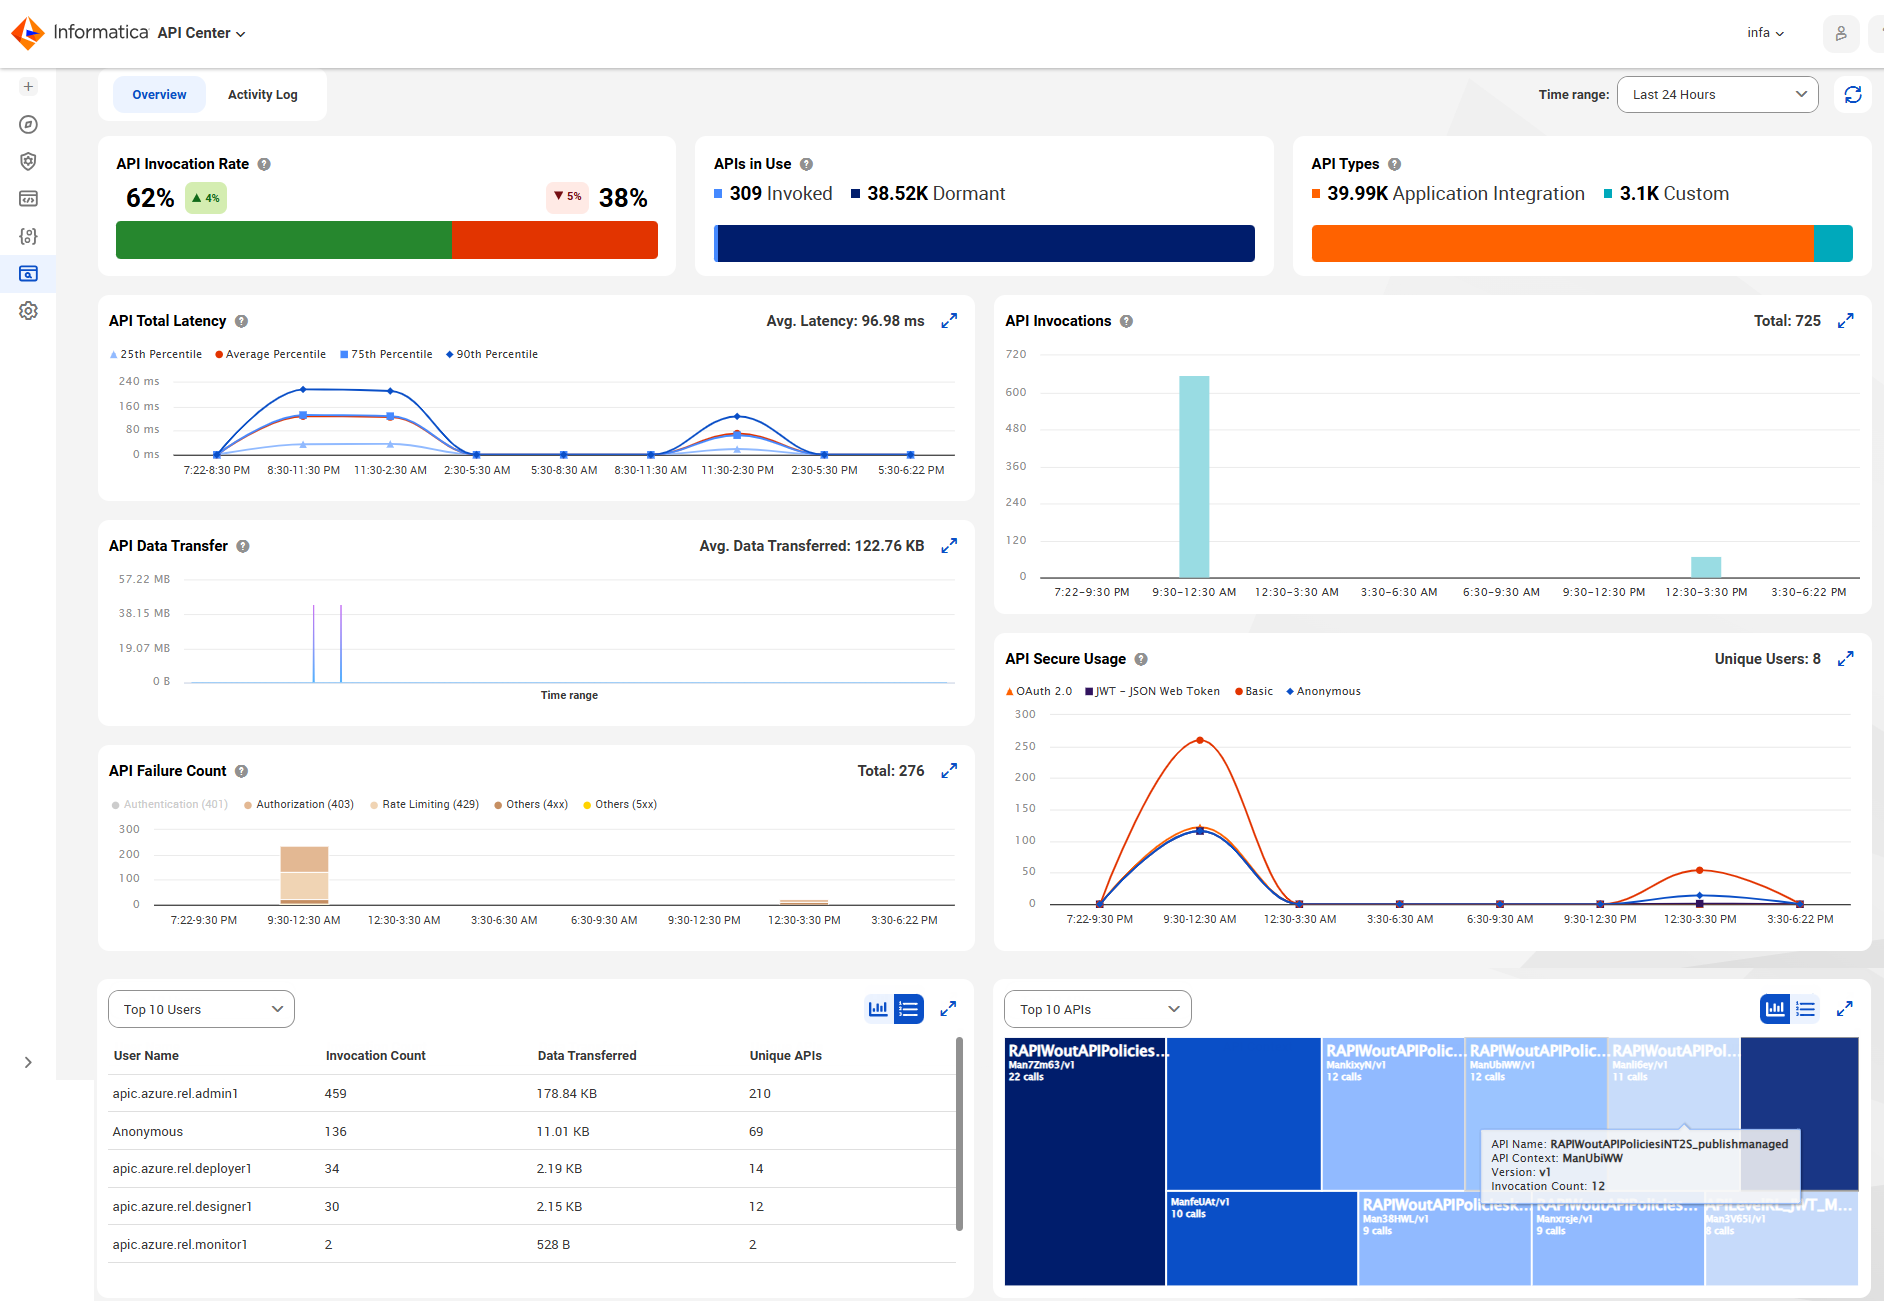
API Invocation Rate | Evaluate API invocation success and failure rates, and track changes over time using trend indicators. Utilize this metric to assess the success and failure rates of API calls and their variations over time. This graph displays API invocation rates as success and failure percentages of the total requests sent to the gateway. Successful requests are displayed as green bars, while failed requests appear as red bars. The following indicators illustrate changes over time:
The trend is calculated based on the selected time range. For instance, if the selected time range is 24 hours, the trend is determined using the data from the previous 24 hours. If the range is 7 days, the trend is calculated using the previous 7 days of data. If no historical data is available, a neutral marker with 0% is displayed. |
APIs in Use | Evaluate the frequency of API invocations within your organization. APIs are categorized as Dormant if they were not invoked during the selected time period, or as Invoked if they have been used at least once. This chart displays metrics for both managed APIs and managed API groups. |
API Types | Identify the different types of APIs in your organization based on the implementation provider. The implementation provider can be Application Integration or a third-party custom provider. Each operation is considered as an API. |
API Total Latency | Understand API latency through percentiles, offering insights into request completion time and performance. You can view the total API latency as a percentile and average latency time in milliseconds. For example, 75th percentile in the chart means that API Center completes 75% of all API requests within a certain amount of time, while the remaining 25% take longer. This metric provides a more comprehensive understanding of API performance compared to average latency, as it shows how quickly most of the requests are handled. You can refer the average percentile to understand the general speed of API requests overall. You can refer the other specific percentile, such as 25th or 90th percentile to understand the latency experienced by most users or the tail-end of slower requests. |
API Invocations | Measure the incoming traffic to the gateway. This chart displays the API invocation counts over a specified time range, regardless of the invocation status. You can also view the total API invocations for a selected time range. |
API Data Transfer | Measure the total amount of data received or transferred as part of the request and response body of all API invocations. |
API Failure Count | Assess the overall health of API invocations. This chart displays the number of API invocation failures due to policy enforcement, service unavailability, or connectivity issues. The following causes of API failures are considered:
|
API Secure Usage | Evaluate API invocations based on the supported authentication types to gain insights into the security posture of your APIs. The following authentication types are analyzed for security:
This chart also displays the total number of unique users. |
Top 5 Users/Top 10 Users | Identify the top users, top 5 or top 10, who have invoked the highest number of APIs and transferred maximum data within a specific time frame. |
Top 5 APIs/Top 10 APIs | Identify the top APIs invoked, top 5 or top 10, including their invocation count, name, context, and version. Note: This chart displays the names of the APIs created after you upgraded to the April 2025 version of API Center. All existing APIs created before April 2025 are deactivated. Activate the deactivated APIs. |