1Click Add Page Tab.
An empty section appears.
2On the Properties tab, enter Relationship Graph in the Title field, and then click Apply.
The page displays the Relationship Graph tab.
3Click the Page Components tab.
The standard and fixed components appear.
4Drag the Relationship Graph component to the empty section.
The Relationship Graph component appears in the section, and the component properties appear.
5Optionally, configure the panels to display.
The following table describes the panels that you can configure:
Panels | Description |
|---|---|
Relationship Graph only | Displays the relationships associated with the record. The Relationship Graph panel displays the visualization of related records. |
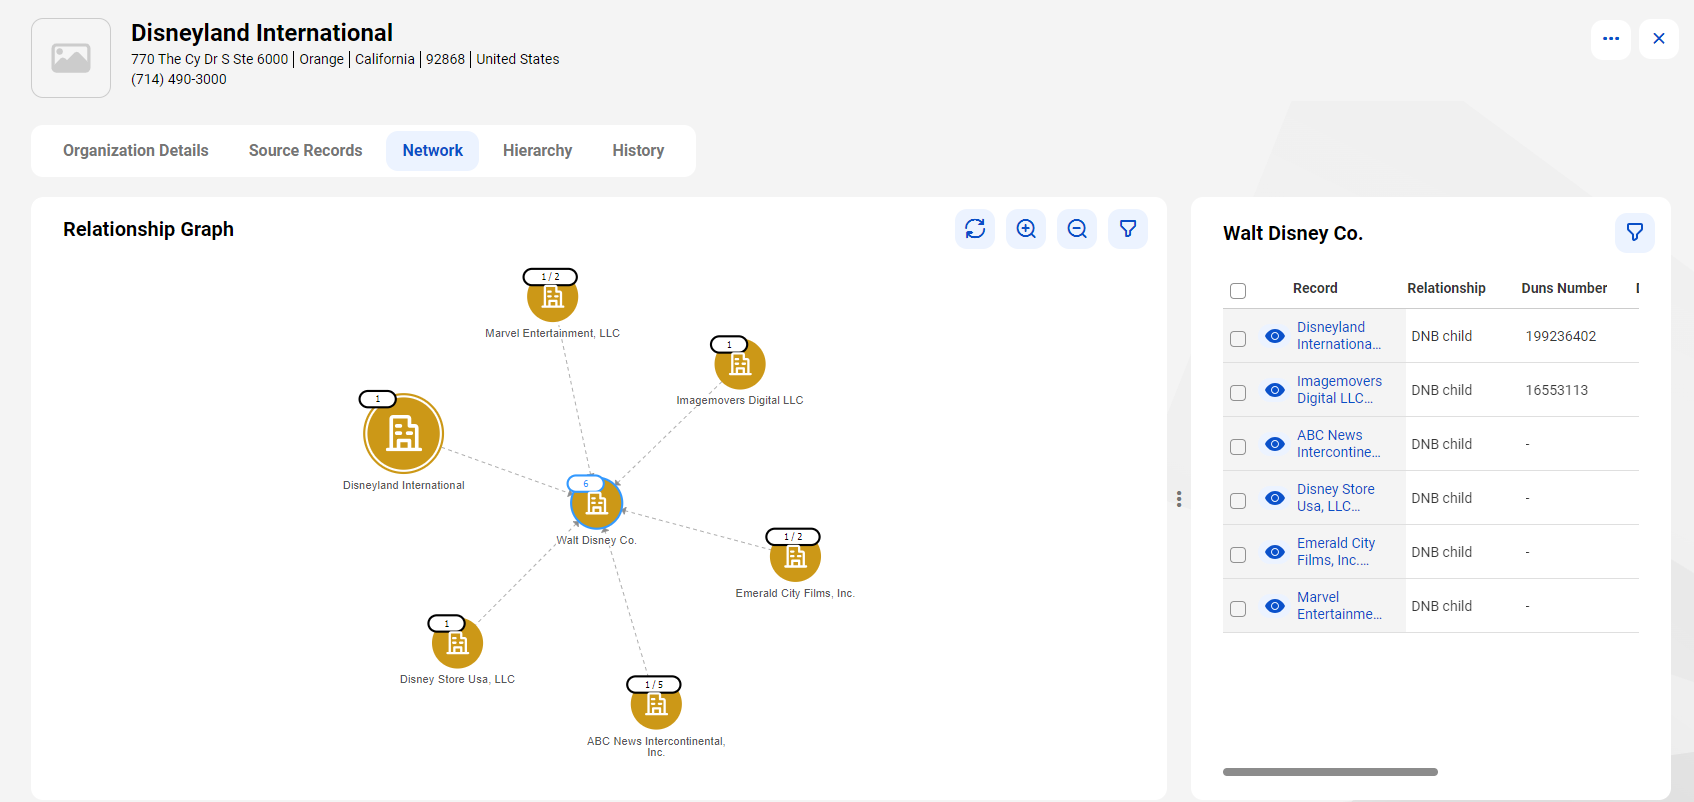
Relationship Graph and Properties | Displays the relationships associated with the record. For each relationship, two panels appear: the Relationship Graph and Properties panels. The Relationship Graph panel displays the visualization of related records. The Properties panel displays the relationship details of the record selected, including the primary relationship attributes, in the Relationship Graph panel. You can sort and filter relationship attributes in the Properties panel. |
The following image shows a sample relationship graph that's rendered using the Relationship Graph component:

6 Optionally, enter the maximum number of relationships that you want to progressively display when users expand nodes on the graph.