You can compare the column results for two or more columns in a profile run. You can compare the results for a maximum of 15 columns.
Example
You are a data quality user. You need to compare the date fields, such as create date of agreement, contract start date, contract end date and similar fields in the Contracts table to analyze the data.
To accomplish this task, you perform the following tasks:
1Create and run a profile on the Contracts table.
2Compare the required columns and view the results for further analysis.
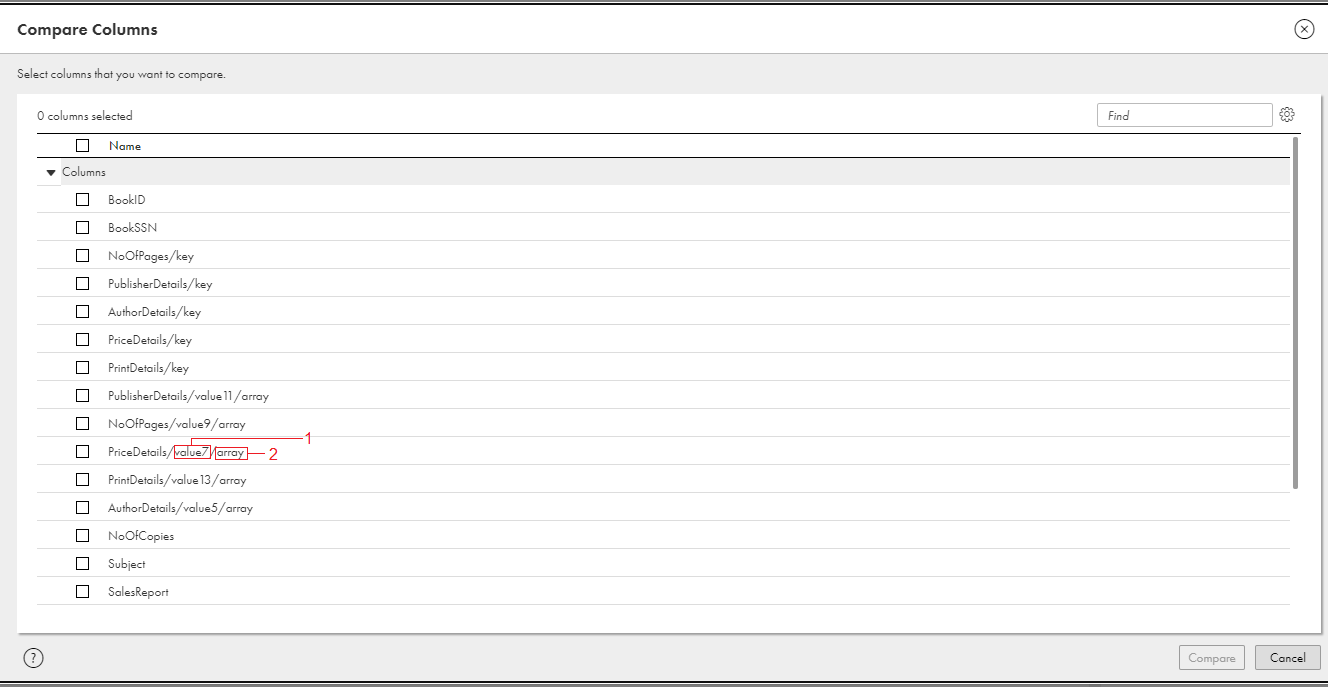
The following image displays a sample Compare Columns dialog box for the nested hierarchical columns and nested columns:
1Nested hierarchical column
2Nested column
Comparing multiple columns in a run
You can select two or more columns in a profile run to compare the column results.
1Open a profile.
2Click Actions > Compare Columns.
The following sample image shows the Compare Columns dialog box:
3In the Compare Columns dialog box, you can perform one of the following actions to select the columns:
- Select Name to select all the columns.
- Choose two or more columns.
- Enter a keyword in the Find field to search for the columns.
4Click Compare.
Compare column results
When you compare the results for two or more columns in a profile run, the comparison results appear on the Compare Columns tab. Each column statistic appears in a row. You can add or delete columns on the Compare Columns tab.
The following sample image shows the Compare Columns tab:
The Compare Columns area shows the following results in collapsible sections:
Metrics
Shows column statistics, such as the value distribution, percentage and number of values, and the minimum and maximum values.
Data Types
Shows the percentages of documented data type and inferred data types in separate rows.
Patterns
Shows the percentages of inferred patterns in separate rows.
Most Frequent Values
Shows the percentages of all the values and their frequencies in a column in separate rows.
Sometimes, the Most Frequent Values might not display all the available values in a column when the number of most frequent values in a column is greater than the Maximum Number of Value Frequency Pairs value. To view all the available values, increase the Maximum Number of Value Frequency Pairs value as necessary.