You can compare the results for two profile runs to analyze and compare the content and statistics. After you select the profile runs to compare, the comparison results appear on the Compare Runs tab.
The later profile run results are compared to the previous profile run results. If a column was added in the later run, the column name appears with the term Added. If a column was removed in the later run, the column name appears with the term Removed.
When you change the source object after multiple runs, Data Profiling retains the profile results for all the profile runs in the profiling warehouse. You can compare the profile results for the previous and current source object. The columns of the previous source object appears as Removed and the columns of the current source object appears Added on the Compare Runs tab.
Example
You are a data steward. You create a profile on the Customer table. You need to identify the customers who were added to or deleted from a subscription in a month.
To accomplish the task, perform the following tasks:
1Run the profile on the Customer table on a monthly basis.
2Compare the latest profile results with the previous one or as required.
3Analyze the compare run results.
The Compare Runs tab displays a tree previewer to help you navigate to the profile runs of the nested columns for profiles that you create with Avro or Parquet source objects.
The following image displays a sample Compare Runs tab with a tree previewer:
Comparing profile runs
You can select two profile runs to compare the profile results.
1Open a profile and view the Results tab.
2Click Actions > Compare Profile Runs.
The following sample image shows the Compare Profile Runs dialog box:
3Choose two profile runs, and click Compare.
Compare run results
When you compare the results for two profile runs, the comparison results appear on the Compare Runs tab.
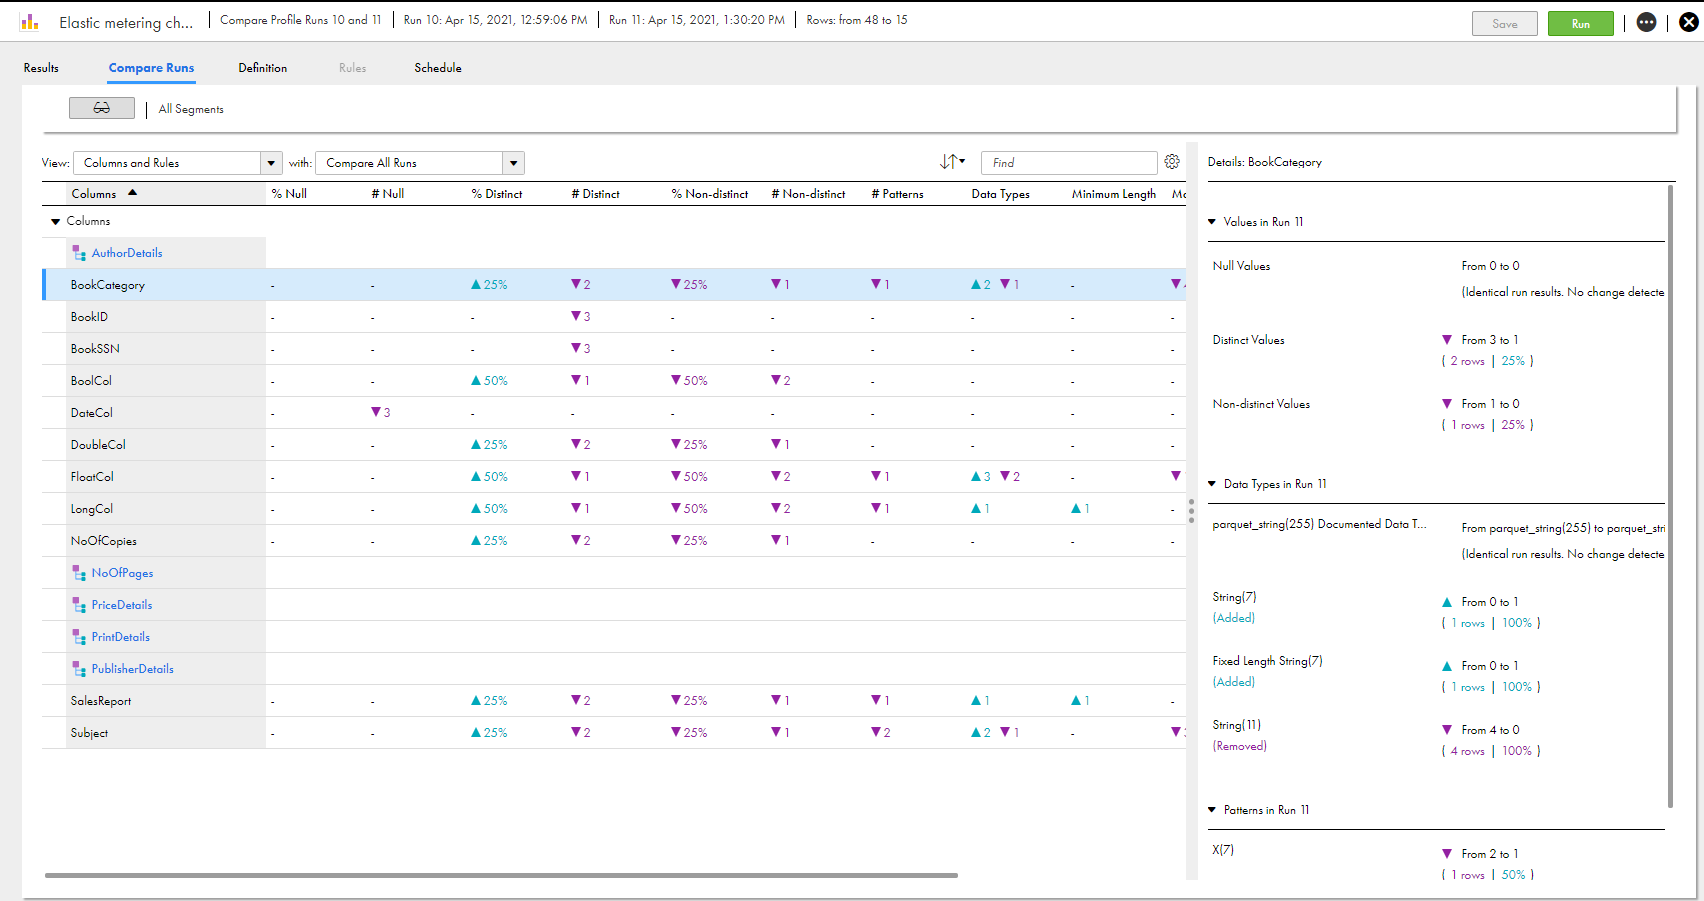
The following sample image shows the areas that you can view on the Compare Runs tab:
1Header
2Filter or find
3Compare statistics
4Details
Header
The header area shows the profile run details which include the profile run numbers, profile run timestamps, and number of rows in the earlier run as compared to the later run.
Filter or find
The following table explains the options that appear in the Filter and find area:
Option
Description
View
Shows the following options:
- Columns and Rules. View the results for all the columns and rules in the profile run.
- Columns. View the results for the columns in the profile run.
- Rules. View the results for the rules in the profile run.
With
Shows the following options:
- Compare All Runs. View the comparison results for both the runs.
- Differences. View the differences in results in both the runs.
- Matches. View the results that match in both the runs.
- Added. Vew the results for columns that was added in the later run.
- Removed. View the results for columns that was removed in the later run.
Choose a filter in the With option after you choose a filter in the View option.
Find
Enter a keyword to view the relevant search results.
Menu
Choose Comfortable, Cozy, or Compact to adjust the row width in the profile results area.
Compare statistics
The compare statistics area shows the columns and rules in collapsible sections. The column statistics in both the runs are compared and displayed in the compare statistics area. An up arrow with a numeric count displays an increase in value for the statistic from the earlier run to later run. A down arrow with a numeric count displays a decrease in value for a statistic. You can choose the statistics that you want to view in the area. To add or remove a statistic, right-click a statistic name and select or clear the statistic.
The following sample image shows the compare statistics area:
The compare statistics area shows column statistics, such as the value distribution, percentage and number of values, data types, patterns, and the minimum and maximum values.
When you click a column, the statistics for the column appear in the Details area for the later run.
Details
In the Details area, you can view the statistics and comparison results. The comparison results include the number of rows in both the runs, difference in row count and row percentage in the later run.
The following sample image shows the Details area:
In this area, you can view the following statistics in collapsible sections:
Values in <later_run>
Shows the comparison results for null values, distinct values, and non-distinct values.
Data Types in <later_run>
Shows the comparison results for inferred data types.
Patterns in <later_run>
Shows the comparison results for inferred patterns.