Insights is a method for discovering data quality issues in your data. The issues can range from anomalous data values to complex inconsistencies. Insights in Data Profiling automates the process to detect data quality issues.
The CLAIRE™ artificial intelligence engine provides insights and generates recommendations for your data that you can approve or reject. CLAIRE can run automatically on profiles and display recommendations that enable you to detect data quality issues. If you approve the recommendations, the Data Quality and Data Profiling services automatically create data quality rules and apply them to your profile to detect the issues.
Note: Insights are available for all source objects that support profiling, except for Avro, Parquet, and JSON source objects that include hierarchical columns.
Generate insights
You can generate and view the inferred insights of a profile on the Insights tab.
1In Data Profiling, select the Enable CLAIRE capabilities checkbox on the Definition tab as shown in the following image:
By default, the Enable CLAIRE capabilities checkbox is enabled for profiles.
2After you enable CLAIRE capabilities, save and run the profile.
The inferred insights generated for the profile appear on the Insights tab.
The following image shows the areas on the Insights tab of a profile:
View options
The following table lists the view and sort options:
Option
Description
View
Shows the following options:
- All Insight Types. View all the insight types in the profile run.
- Completeness Check. View the insights generated where the data appears incomplete. The column can include one or more null, blank, or empty values or values that contain only zeros.
- Uniqueness Check. View the insights generated when the majority of the data values in the column are unique.
- Column Length Deviation. View the insights generated when length of the data values in the column has a high standard deviation.
- Number Value Distribution. View the insights generated for numeric values found outside the 95% standard deviation range.
- Date Validity Check. View the insights generated for one or more dates that do not comply with a valid date pattern.
- Date-Locale Check. View the insights generated for one or more date values that do not match the locale format.
- Day-Date Distribution. View the insights generated for unusual distribution of day values in a date column.
- Month-Date Distribution. View the insights generated for unusual distribution of month values in a date column.
- Year-Date Distribution. View the insights generated for unusual distribution of year values in a date column.
- Top Pattern Stability. View the insights generated when the topmost pattern of the column decreases by a large amount when compared to the previous profile run.
- Spelling Analysis. View the insights generated for the data values that are phonetically similar and contain inconsistent spelling.
- Distribution Shift. View the insights generated for the distribution of the data that might have shifted more than expected based on the mean and standard deviation of the profile that has run over multiple times.
- Column Token Deviation. View the insights generated for the number of tokens in a column that has a high standard deviation.
- Special Characters. View the insights generated when columns with special characters are not included in the top 80% of the patterns.
- Null Date Analysis. View the insights generated when the string data type columns contain values from a default date pattern, such as 00/00/0000 and 99/99/9999.
In
Shows the following options:
- All Columns. View the insight types for all columns in the profile run.
- Columns included in the profile run.
Choose a filter in the In option after you choose a filter in the View option.
Sort
Choose any of the following options to sort the insights in ascending or descending order:
- Insight Statement
- Score
- Insight Type
- Columns
Find
Enter a keyword to view the relevant search results.
Menu
Choose Comfortable, Cozy, or Compact to adjust the row width on the Insights area.
Insights
The Insights area displays the CLAIRE generated recommendations for your data that you can approve or reject.
The following table lists the properties that you can view on the Insights tab:
Property
Description
Insight Statement
Description or statement that explains the inferred insight.
Score
Shows the following scores for the inferred insights:
- High. Data anomaly is high.
- Medium. Data anomaly is medium.
- Low. Data anomaly is low.
You can classify and review the inferred insights from higher sores to lower scores.
Insight Type
Shows the following types of insights:
- Completeness Check. Data appears incomplete. The column includes one or more null, blank, or empty values or values that contain only zeros.
- Uniqueness Check. The majority of the data values in the column are unique.
- Column Length Deviation. The length of the data values in the column has a high standard deviation.
- Number Value Distribution. Numeric values found outside the 95% standard deviation range.
- Date Validity Check. One or more dates do not comply with a valid date pattern.
- Date-Locale Check. One or more date values do not match the locale format.
- Day-Date Distribution. Unusual distribution of day values in a date column.
- Month-Date Distribution. Unusual distribution of month values in a date column.
- Year-Date Distribution. Unusual distribution of year values in a date column.
- Completeness Variation.
- For integer or decimal data types: Unusual variation in the number of null values and values that contain only zeros in the column between the current profile run and the previous one to five profile runs.
- For string, date, or timestamp data types: Unusual variation in the number of blank values, null values, and empty values in the column between the current profile run and the previous one to five profile runs.
- Distinct Variation. Greater than 70% increase in the number of distinct values in the column between the current profile run and the previous one to five profile runs.
- MinMax Variance. Greater than 70% increase in the difference between the minimum and maximum values in the column across the current and previous profile runs.
- Top Pattern Stability. The topmost pattern of the column decreased by a large amount when compared to the previous profile run.
- Spelling Analysis. The data values that are phonetically similar and contain inconsistent spelling.
- Distribution Shift. The distribution of the data that might have shifted more than expected based on the mean and standard deviation of the profile that has run over multiple times.
- Column Token Deviation. The number of tokens in a column that has a high standard deviation.
- Special Characters. Columns with special characters that are not included in the top 80% of the patterns.
- Null Date Analysis. String data type columns that might contain values from a default date pattern, such as 00/00/0000 and 99/99/9999.
Columns
Column name for which the insight is relevant.
Status
Status of the insight. When insights are generated for the first time, the status appears blank.
Each insight type follows an algorithm to look into columns, independently of other columns on the data set. These algorithms are based on the metrics calculated on every profile run. The following table lists the algorithm and the logic used to arrive at the scores for the inferred insights:
Insight Type
Algorithm
Score Interpretation
Completeness Check
Computes the percentage of total rows with null values, blank values, empty values, or values that contain only zeros in a column.
This insight type is applicable for columns with any of the following data types:
- String
- Date
- Integer
- 0 - OK
- 92 to 100 - OK
- 0 to 3 - Low
- 3 to 5 - Medium
- 5 to 8 - High
Uniqueness Check
Computes the percentage of non-unique rows based on the following formula:
Percentage of non-unique rows = (Total Rows - Unique Rows) / Total Rows * 100
Insights are generated if the computed percentage of non-unique rows is less than 3%.
Note: If a column contains one or more null values, then the insight is not generated.
This insight type is applicable for columns with any of the following data types:
- String
- Date
- Integer
- 0 - OK
- 0 to 2 - High
- 2 to 3 - Low
Column Length Deviation
Computes the length of alphanumeric values or numeric values on value frequency that falls more than two times the standard deviation from the mean value.
This insight type is applicable for columns with any of the following data types:
- String
- Integer
- Decimal
- 0 - OK
- 0 to 1 - Low
- 1 to 5 - Medium
- 5 - High
Number Value Distribution
Computes the percentage of value frequency values in relation to the total number of rows profiled that falls more than two times the standard deviation or falls out of 95% of the mean value.
This insight type is applicable for columns with any of the following data types:
- String with all numeric patterns
- Date
- Integer
- 0 - OK
- 15 to 100 - OK
- 0 to 1 - Low
- 1 to 5 - Medium
- 5 to15 - High
Note: The score can never be 100%.
Date Validity Check
Checks only for columns that have Date as the inferred data type and computes the percentage of values with dates that do not comply with a valid date pattern.
Null values are ignored in the computation.
This insight type is applicable for columns that have String with date content as the data type.
- 0 - OK
- 0 to 5 - Low
- 5 to 10 - Medium
- 10 - High
Date-Locale Check
Checks for columns that have one or more date values that do not match the locale format. Computes the number of values that follow different date locale formats.
This insight type is applicable for columns with String data type.
- 1 - OK
- 2 - Medium
- 3 - High
Day-Date Distribution
Extracts the day for the dates on the value frequency and calculates the mean and standard deviation. Computes the dates where the days fall over two times the standard deviation or falls out of 95% of the mean value.
This insight type is applicable for columns with any of the following data types:
- String with date patterns
- Date
- Timestamp
- 0 - OK
- 15 to 100 - OK
- 0 to 1 - Low
- 1 to 5 - Medium
- 5 to15 - High
Note: The score can never be 100%.
Month-Date Distribution
Extracts the month for the dates on the value frequency and calculates the mean and standard deviation. Computes the dates where the days fall over two times the standard deviation or falls out of 95% of the mean value.
This insight type is applicable for columns with any of the following data types:
- String with date patterns
- Date
- Timestamp
- 0 - OK
- 15 to 100 - OK
- 0 to 1 - Low
- 1 to 5 - Medium
- 5 to15 - High
Note: The score can never be 100%.
Year-Date Distribution
Extracts the year for the dates on the value frequency and calculates the mean and standard deviation. Computes the dates where the days fall over two times the standard deviation or falls out of 95% of the mean value.
This insight type is applicable for columns with any of the following data types:
- String with date patterns
- Date
- Timestamp
- 0 - OK
- 15 to 100 - OK
- 0 to 1 - Low
- 1 to 5 - Medium
- 5 to15 - High
Note: The score can never be 100%.
Completeness Variation
Computes the variation on the number of null values and the values that contain only zeros in the column between the current profile run and the truncated mean of the last five profile runs, discarding the lowest and highest values. Uses the actual mean if there are less than four previous profile runs. Insights are not generated if there are no previous profile runs.
Percentage of completeness variation = (Current Mean - Previous Mean) / Previous Mean * 100
- If the previous mean value is zero, then the completeness variation percentage increases to 100%.
- If the completeness variation percentage is negative, then insights are not generated.
The following values are considered as null values for data types:
- Integer - 0 and null values
- Decimal - 0.0 and null values
- String - Blank or empty string and null values
- Date - Null values
- Timestamp - Null values
- [0 to 80] - OK
- (80 to 90] - Medium
- (90 to ∞) - High
Distinct Variation
Checks if there is more than 70% increase on the number of distinct values in the column between the current profile run and the truncated mean of the last five profile runs, discarding the lowest and highest values. Uses the actual mean if there are less than four previous profile runs. Insights are not generated if there are no previous profile runs.
Percentage of distinct variation = (Current Mean - Previous Mean) / Previous Mean * 100
If the previous mean value is zero, then the distinct variation percentage increases to +∞. If the distinct variation percentage is negative, then insights are not generated.
- (-∞ to 70] - OK
- (70 to 90] - Low
- (90 to 200] - Medium
- (200 to +∞) - High
MinMax Variance
Checks if there is more than 70% increase on the difference between the minimum values and the maximum values in the column when compared to the previous profile run.
CLAIRE does not consider columns for insight recommendations in the following scenarios:
- Difference between the minimum values and the maximum values in the column when compared to the previous profile run decreases.
- Sources that have less than 1000 rows.
- Columns that transition from 100% null to values.
Percentage of min max variation = (Delta Current - Delta Previous) / Delta Previous * 100
Where:
- Delta Previous = Maximum value in the first run - Minimum value in the first run
- Delta Current = Maximum value in the second run - Minimum value in the second run
For example, the following are the minimum and maximum values in the po_create_date column for two profile runs:
- Previous run: Minimum = 01/01/1998, Maximum = 03/03/2013
- Current run: Minimum = 02/01/2003, Maximum = 12/07/2025
Delta Previous = 5540 days
Delta Current = 8345 days
Percentage of min max variation = (8345 - 5540) / 5540 = 50.6%
The 50.6% score interprets the data anomaly for the column as OK.
- [0 to 70] - OK
- (70 to 100] - Medium
- (100 to ∞) - High
Top Pattern Stability
Checks if the top pattern with ≥30% compliance decreases by a large amount in comparison to the previous profile run. A large decrease may indicate that shape of data changed more than expected. The decrease is measured as a negative number computed using the following formula: CurrentPercent - PreviousPercent / PreviousPercent * 100
The insight considers columns that contain a major pattern in the previous run. The same filter must be used for the both runs
- (-99, -70] - High
- (-70, -60] - Medium
- (-60, -30] Low
- (-30, 0] - OK
Spelling Analysis
Creates a fingerprint for each string value and compares the number of non-null unique fingerprints to the number of non-null values. CLAIRE runs the insight if the difference as a percentage is too high, which indicates several misspellings.
To qualify, the top 80% patterns must contain only letters (X) and up to 3 spaces and hyphens. This is to accommodate names.
The insights get generated if 95% of the value frequencies in the values have five or more characters.
- [0,0.5] - OK
- (0.5,1] - Low
- (1, 2] - Medium
- (2,100] - High
Distribution Shift
Tracks the mean and standard distribution of values over four or more profiles. The expectation is either the mean and standard deviation remains constant or shifts consistently up or down. For example, a table containing population size information that might shift consistently up or down at the same rate.
This insight type is applicable for columns with any of the following data types:
- Integer
- Decimal
- [0,2] - OK
- (2,3] - Medium
- (3,∞] - High
Column Token Deviation
The number of tokens in the value frequency string values that fall more than two standard deviations from the mean. A token is any sequence of alpha-numeric characters separated by white space and the following special characters: . , / -.
- 0 - OK
- (0,1] - Low
- (1, 5] - Medium
- (5,100] - High
Special Characters
Checks data for special characters that are not included in the top 80% of the patterns. CLAIRE considers this data anomalous. Additionally, CLAIRE does not consider the string data types when Data Profiling infers the numeric data type such as decimal, integer, or float as 100%.
- 0 - OK
- (0,1] - Low
- (1, 3] - Medium
- (3,100] - High
Null Date Analysis
Checks string data type columns that might include one of all the zeros or nine values from a default date pattern. The insight type is applicable for columns of string data type.
If a string data type column contains all of the zeros and nines from the default date pattern, the insight considers the values as invalid. For example,
- 0000-00-00 or 9999-99-99 (year-month-day or year-day-month)
- 00/00/0000 or 99/99/9999 (month/day/year or day/month/year)
- 00000000 or 9999999 (YYYYMMDD)
If a string data type column contains a valid date, month, or year part from the default date pattern, the insight considers the values as valid. For example,
- 21/99/9999
- 99/02/9999
- 99/99/1994
The insight also considers a NULL value as a valid date pattern.
- 0 - OK
- (0,1] - Low
- (1,2] - Medium
- (2,100] - High
Insight status
The Insights status area displays the status of the insights. When insights are generated for the first time, the status appears blank. You can approve or reject the generated insights and save the profile.
When you approve an insight, the status of the insight changes to "Approved, Pending". When you save the profile, the status of the insight changes to "Approved". When you reject an insight, the status of the insight changes to "Reject, Pending". When you save the profile, the status of the insight changes to "Disapproved".
Review and act on insights
You can review the inferred insights generated by the CLAIRE engine in Data Profiling. Hover the mouse over the insight to approve or reject the insight. After you review the insights, you need to save and run the profile.
You can click on the or icons to approve or reject the insights. When you approve an insight, a rule specification is created in Data Quality and the rule is assigned to the profile automatically. After approval, the status of the insight changes to "Approved, Pending". When you save the profile, the status of the insight changes to "Approved". A rule specification is automatically created and appears on the Rules tab for the columns to which the insight is referred to. You must save the profile to persist the status and the rule association. Once an insight is approved, the insight cannot be removed from the profile unless you delete the corresponding rule specification from the Rules tab of the profile.
When you approve an insight, a rule specification is created that monitors the quality of the column corresponding to the insight. For example, an algorithm to detect outlier based on the value frequency length. CLAIRE recommends that any value frequency with length greater than 5 is invalid. A new rule specification is automatically created with the logic to verify for values greater than 5 and tags them as invalid. The rule specification is also automatically assigned to the column in the profile.
The following image shows the automatically created rule specifications assigned to the corresponding source columns in the profile on the Rules tab:
When you reject an insight, the status of the insight changes to "Reject, Pending". You must save the profile to complete the rejection. When you save the profile, the status of the insight changes to "Disapproved".
To review multiple insight statements, select the insights and click on the or icons on the top of the Insights area.
You can reset a pending insight review. An insight with "Approved, Pending" or "Reject, Pending" status can be cleared. Hover the mouse over the insight and click on the icon to reset the review. The status of the insight disappears. You can click on the icon on the top of the Insights area to reset all the pending insights. You can select the Hide Rejected Insights checkbox to hide all the rejected insights.
Note: If an insight is approved or rejected, the same algorithm is not used again for the same columns.
After review of the inferred insights, you can drill down and view the anomalous data values and complex inconsistencies on the Results tab. For more information about profile results, see Profile results. You can also create rule occurrences and view scorecards to measure data quality scores and monitor data quality progress for profiles. For more information about rule occurrences and scorecards, see Rule occurrences and scorecards.


 or
or  icons to approve or reject the insights. When you approve an insight, a rule specification is created in
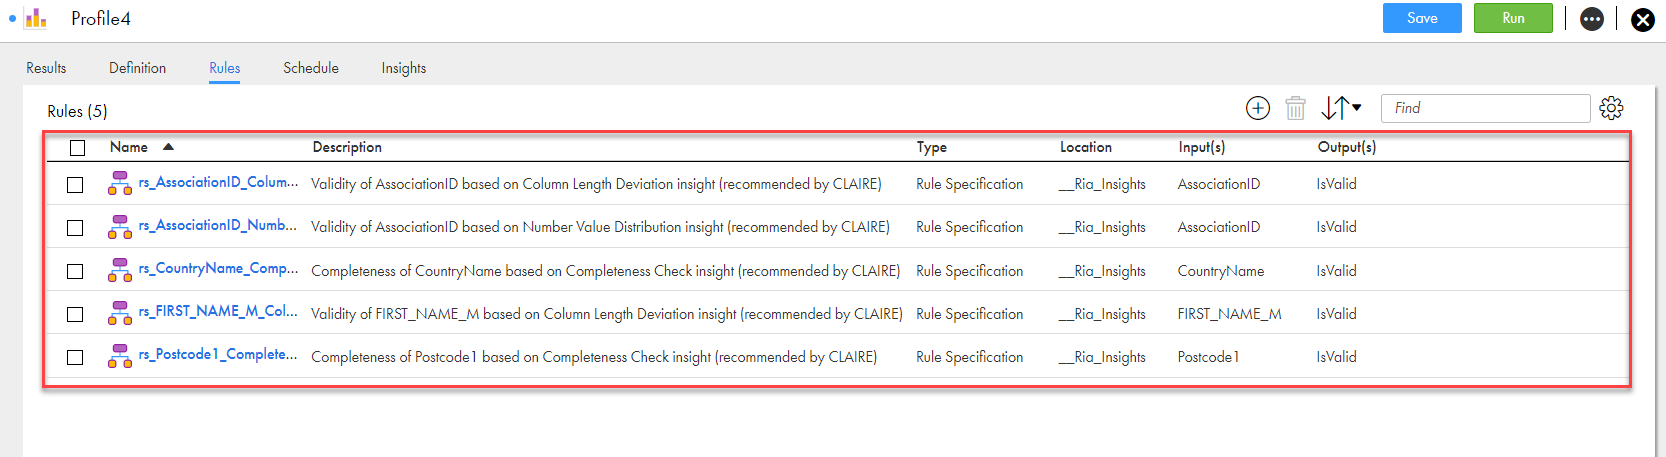
 or
or  icons on the top of the Insights area.
 icon to reset the review. The status of the insight disappears. You can click on the
  icon on the top of the Insights area to reset all the pending insights. You can select the