You can view the profile results for a profile run on the Results tab. The tab appears after you run the profile. The Results tab contains a header area with profile run details, filter and sort area, profile results area, details and rules area, and data preview area. The profile results area shows the profile results for all the columns and rules in summary view. When you click a column, a detailed view of the profile results for the column appears in the area.
The following image shows the areas on the Results tab:
1Header
2Filter and sort
3Profile results
4Details and Rules
5Data Preview
Note: You can also open a profile from the Explore page in Data Quality and perform the following:
•Edit a profile
•Run a profile
•View profile results
•Create and run queries on the source object
•Drill down on the profile results
Header
The header area shows the profile run details, which include the profile name, run number, number of columns and rules in the profile run, number of rows in the profile run, and run timestamp. The header area also displays a warning icon if the profile job runs with a warning. To view the job that ran with a warning, hover over the warning icon, and then click View.
Filter and sort
The following table lists the filter and sort options:
Option
Description
View
Shows the following options:
- Columns and Rules. View the results for all the columns and rules in the profile run.
- Columns. View the results for the columns in the profile run.
- Rules. View the results for the rules in the profile run.
With
Shows the following options:
- All Statistics. View the complete profile results for the profile run.
- 100% Null <number_of_rows>. View the results for the columns and rules that have only null values.
- 100% Distinct <number_of_rows>. View the results for the columns and rules that have only distinct values.
- 100% Constant <number_of_rows>. View the results for the columns and rules that have the same value for all the rows.
- Conflicting Data types <number_of_rows>. View the results for the columns and rules where the documented data type and inferred data type do not match.
- Value Frequency Outliers <number_of_rows>. View the results for the columns or rules with value frequency outliers.
- Pattern Outliers <number_of_rows>. View the results for the columns or rules with pattern outliers.
Choose a filter in the With option after you choose a filter in the View option.
Sort
Choose a column statistic to sort the results in ascending or descending order.
Filter
To filter the results, you can perform one or both of the following actions:
- Add a column and enter a valid value. Add more columns with valid values as necessary.
- Add a column statistic and enter a valid value. Add more column statistics with valid values as necessary.
Find
Enter a keyword to view the relevant search results.
Menu
Choose Comfortable, Cozy, or Compact to adjust the row width in the profile results area.
Profile results: summary view
When you open a data profiling task or choose a profile run, the summary view of the profile results appears. The summary view shows all the columns and rules and their statistics in the profile run.
The following image shows the summary view of profile results for columns and rules and the results are sorted by minimum value:
You can view the columns and rules area in collapsible sections. You can view the value distribution, number and percentage of null, distinct, and non-distinct values, number of patterns, percentage of top pattern, maximum value and length, and minimum value and length in the column or rule.
You can sort the columns and rules based on one of the statistics. To sort the columns and rules, click one of the statistics. For example, if you want to view the maximum value in ascending order, click Maximum Value. The columns are sorted in ascending order of maximum values.
Profile statistics can display percentage values to two decimal places.
If all of the values in a source data column meet a given statistical condition, the profile displays 100% for the column. If none of the values in the column meet the condition, the profile displays 0% for the column. In all other cases, the profile returns a percentage value between 0.01% and 99.99% to demonstrate that one or more source data values do not meet the condition.
For example, if a single value in a column of ten million values is null, the statistical score in the % Null column appears as 0.01%. If a single value in a column of ten million values is not null, the score in the % Null appears as 99.99%.
Profile results: detailed view
When you click a column in the summary view, the detailed view of the profile results for the column appears. The area shows the column values in a graphical mode. The null values appear as red vertical bars.
The following image shows the detailed view of the profile results area:
1Column or rule output name
2Number of distinct values, which includes non-unique values and unique values
3Sort By
4Bar chart
5Detailed chart
6Value distribution table
The following table lists the properties in the detailed view:
Property
Description
Column <column_name>
Rule <rule_output_name>
Shows the column name or rule output name.
Back to Summary
Click the button to go back to the summary view of profile results.
Shows the total number of distinct values in the column or rule. This property also shows the number of non-unique and unique values, with the color legend, in the column or rule.
Sort By
You can sort the value frequency distribution based on the date, integer, and decimal data types.
Choose Frequency or Value, and then choose Ascending or Descending to sort the value frequency distribution as required.
Bar chart
Shows the values as a vertical bar chart. You can view a maximum of 16,000 values in the upper area. You can slide the slider over the values in the upper area. The lower area displays the values in the slider. The outlier values appear with an orange underline.
Detailed chart
Shows the values in the slider in the upper area. By default, 50 values appear in the lower area. You can choose to view 75 or 100 values at a time. The outlier values appear with an orange underline.
Value distribution table
Shows the following statistics in a tabular format:
- #. Row or field number in the source object.
- Value. List of values in the column.
- Frequency. Number of times the value appears in the column, expressed as a number.
- Percentage. Value percentage in the column.
- Length. Length of the column value.
The outlier values appear with a vertical bar.
By default, you can view 500 values in the detailed view. To increase or decrease the number of the values that you can view, configure the Maximum Number of Value Frequency Pairs option on the Schedules page and then run the profile.
To view the drilldown results for a value, perform the following steps:
1Select a value in the detailed view.
The value appears as a filter in the Data Preview area.
2Click Apply.
The drill down results for the value appears in the Data Preview area.
Details and Rules
When you select a column or rule in the profile results area, the Details tab shows the trend of values across multiple profile runs, documented and inferred data types, inferred patterns, and most frequent values for the selected column. If the column has a numeric documented data type, the Numeric Column Statistics section also appears for the column. The Rules area shows the rules associated with the column in the profile run.
The following image shows the Details and Rules area:
The following table lists the sections and statistics that appear in the Details and Rules area:
Section
Description
Trend
Trend chart for percentage change in null, distinct, and non-distinct values. The trend chart shows the change for a maximum of 10 profile runs in a line chart.
The chart displays the trend based on the profile run you have selected.
For example, consider that there are 20 profile runs, and you are viewing the tenth profile run. In this case, the trend appears for five profile runs before the tenth profile run and four runs after the tenth profile run.
Data Types <number_of_inferred_data_type>
Shows the documented data type for the column in the data source. The section also shows the inferred data type, frequency percentage in which it appears in the column or rule, and a horizontal bar chart which is a virtual representation of data type distribution. Hover over the bar chart to view the number of rows that has the inferred data type.
Select a data type to drill down and view the drilldown results in the Data Preview area.
Patterns <number_of_inferred_patterns>
Shows the inferred pattern, frequency percentage in which it appears in the column or rule, and a horizontal bar chart which is a virtual representation of pattern distribution. Hover over the bar chart to view the number of rows that has the inferred data type.
Select a pattern to drill down and view the drilldown results in the Data Preview area.
Most Frequent Values
Shows the top five values that appear frequently in the column.
Numeric Column Statistics
Shows the following statistics for columns with numeric documented data type:
- Average. Displays the average of the values for the column.
- Sum. Displays the sum of all the values in the column.
- Standard Deviation. Displays the standard deviation or variability between column values for all values of the column.
- #Zero. Number of rows that contain the value 0 in the column or rule.
- %Zero. Percentage of rows that contain the value 0 in the column or rule.
Rules
Shows the associated rules for the column and the rule details.
Data Preview
When you open a profile, the Data Preview area shows a maximum of 10 rows in the profile run results. When you select a column in the summary view of profile results, the column is highlighted in the area.
To view the drilldown results in the Data Preview area, perform one of the following actions:
•Choose a value in the detailed results area.
•Choose a pattern or data type in the Details and Rules area.
After you choose a value, pattern, or data type, it appears as a filter in the Data Preview area. Continue to add statistics or values if required. Click Apply to view the filtered drilldown results. Optionally, if you want to change the selected data type, pattern, or value, click the drop-down list to select the required statistics or values. Data Profiling creates and runs a subtask when you click Apply after you add or change a statistic or value.
For example, you are a data analyst and you want to view duplicate data for SSN in the Customer table. To accomplish this task, you perform the following actions:
1Create a data profiling task for the Customer table.
2Run the profile.
3In the profiling results, click the pattern for SSN which is 999-99-9999.
The Data Preview area shows all the rows with the pattern 999-99-9999.
View tree previewer for hierarchical columns
You can view the tree previewer () for a profile run that includes hierarchical columns from Avro and Parquet source objects in the Results tab. Hierarchical columns are classified as columns of data types such as an array, struct, map, or union. Use the tree previewer to view all the nested hierarchical columns within the hierarchical columns.
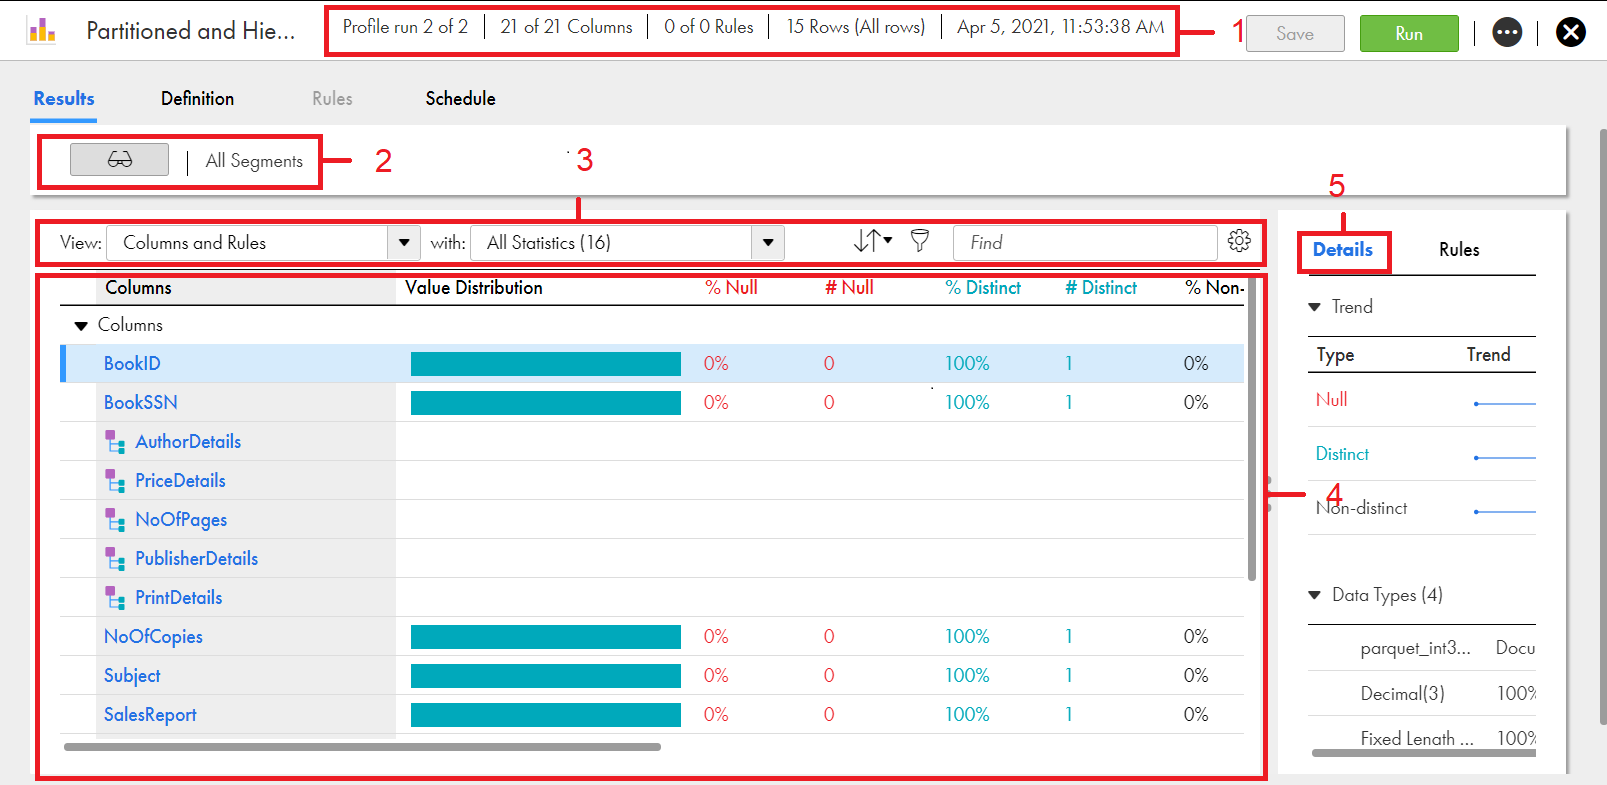
The Results tab contains a header area with profile run details, tree previewer area, filter and sort area, profile results area, and details area.
The following image shows the areas on the Results tab:
1Header
2Tree previewer
3Filter and sort
4Profile results
5Details
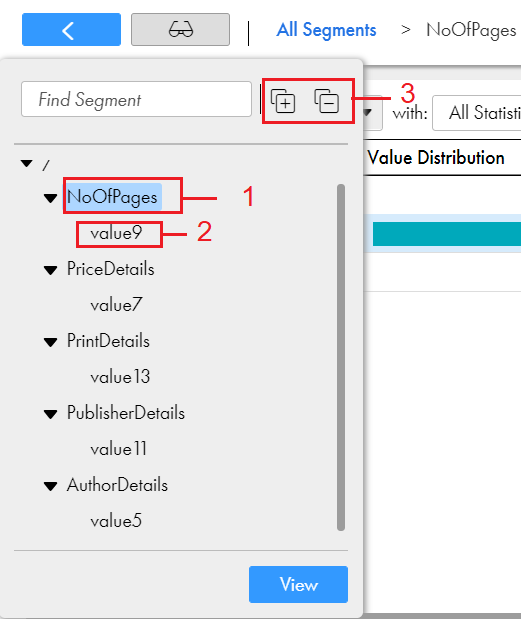
Tree previewer
The tree previewer area displays the hierarchical and nested hierarchical columns. To view profile results for nested columns, click the tree previewer icon (), and then click the hierarchical column name or nested hierarchical column name from the tree previewer window.
The following image shows the sample tree previewer window:
1Hierarchical column
2Nested hierarchical column
3Expand and collapse view
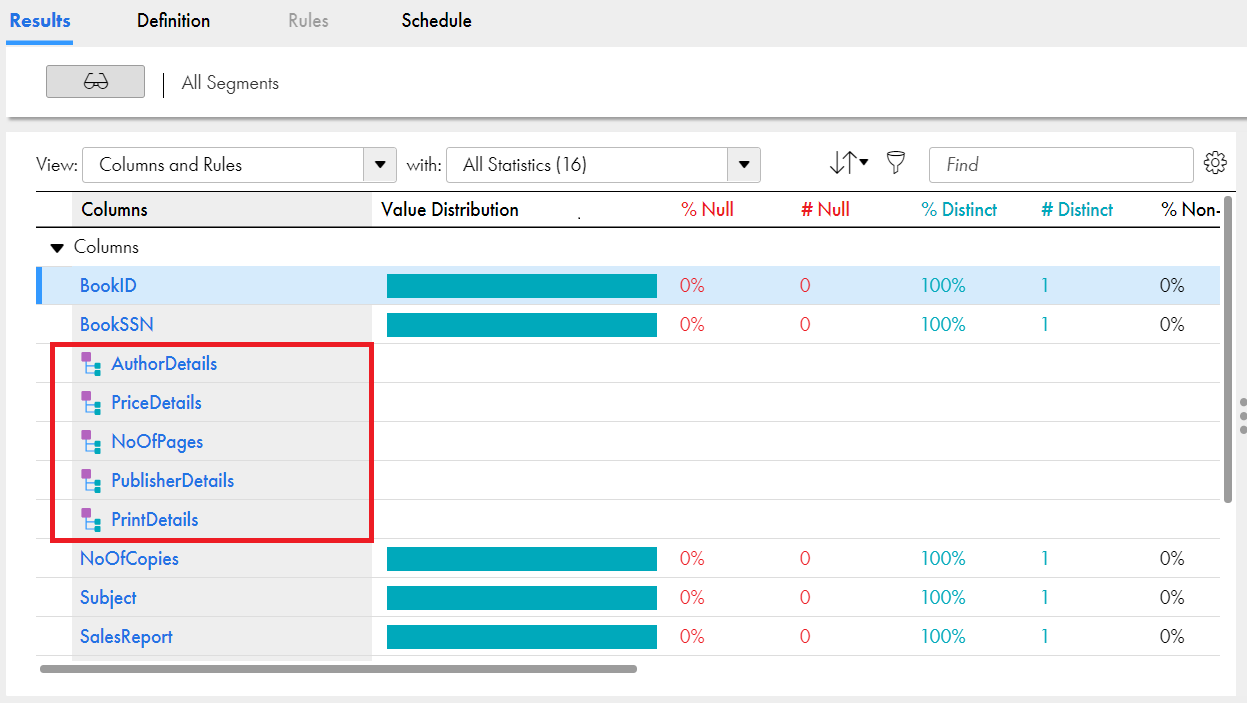
Profile results
The profile results area, by default, shows the profile results for all the columns in the summary view. When you click a non-hierarchical column, a detailed view of the profile results for the column appears. To view details of a hierarchical column, click the hierarchical column name. The hierarchical columns details view can include nested columns and other nested hierarchical columns. When you click the nested column name, a detailed view of the profile results for the nested column appears.
The following image shows the hierarchical columns in the Results tab:
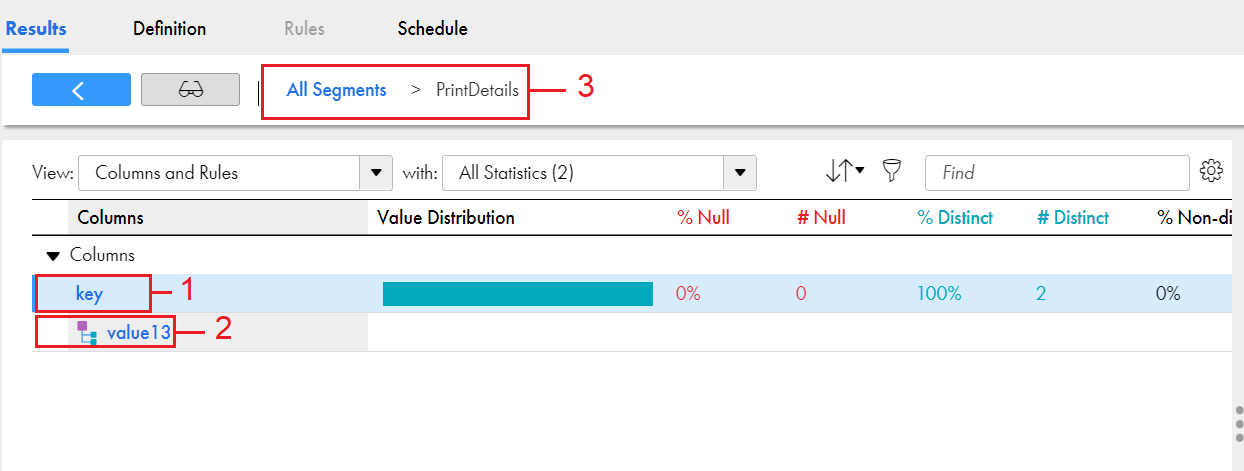
The following image shows the nested hierarchical columns and nested columns in the Results tab:
1Nested column
2Nested hierarchical column
3Breadcrumb to navigate between the segments and show the flow of the parent and child segments.


 ) for a profile run that includes hierarchical columns from Avro and Parquet source objects in the Results tab. Hierarchical columns are classified as columns of data types such as an array, struct, map, or union. Use the tree previewer to view all the nested hierarchical columns within the hierarchical columns.