You can explore records with specific search criteria and download the sample data with CLAIRE GPT.
After you search for records in CLAIRE GPT, navigate to a specific MDM SaaS business application to view additional search results.
Additionally, you can also explore field groups and nested field groups with multiple entries. CLAIRE GPT displays the entry that matches the prompt along with additional field group entries. For example, when you ask CLAIRE GPT to display the shipping address of a person, it displays the shipping address of the person along with additional addresses. You can also search for records based on a specific date or date range. You can also explore relationships and hierarchies in MDM SaaS. For example, when you ask CLAIRE GPT to display the relationship between two records, it displays how the records are related to each another with a relationship graph. You can view only direct relationships.
You can start a conversation in CLAIRE GPT, seamlessly switch to an MDM SaaS business application, and continue it in CLAIRE Copilot. In CLAIRE Copilot, you can use the same MDM SaaS prompts that you use in CLAIRE GPT.
Prerequisites
Before you perform data exploration tasks in CLAIRE GPT for MDM SaaS, ensure that you perform the following tasks:
•Enable the MDM SaaS service for the runtime environment that your organization uses.
•Verify that business entities are available in MDM SaaS.
•Upgrade Customer 360 SaaS, Product 360 SaaS, and Supplier 360 SaaS to the latest version.
•Ensure that the prompts include values from fields that are set as searchable and facetable in Business 360 Console.
If the prompt contains data from fields that aren't searchable and facetable in Business 360 Console, CLAIRE GPT can't visualize or search for data.
•Verify that your user role has the read privilege for business entities and attributes that you use in the prompts.
•To retrieve accurate prompt responses in CLAIRE GPT, ensure that the business entity attributes contain meaningful descriptions in Business 360 Console.
For example, a business entity includes two City attributes, one for address and one for the place of birth. If your prompt is to find customers living in New York, CLAIRE GPT refers to the attribute description for the context.
•You can't use prompts to compare field values within business entities.
For example, CLAIRE GPT doesn't return results for prompts, such as show me the list of records with the same marital status from Person and list all records with the same designation in Organization.
•To explore relationships and hierarchies, ensure that you specify the name of the business entity in the prompt.
•When you explore records with multiple field group entries, CLAIRE GPT returns the records with the specific field group entry that you search for along with the other field group entries.
For example, if you enter a prompt to Find all @Person records and retrieve their home address, CLAIRE GPT returns the records with home address along with other address field group entries, such as billing address, shipping address, and office address.
For information about how to set up CLAIRE GPT for users in your organization, see Administer CLAIRE GPT.
Sample conversation
Let's take a look at a sample conversation to help you get started on your data exploration journey in CLAIRE GPT.
You're a data steward and you want to analyze all item records and top selling brands for an upcoming marketing campaign. To better understand the sales distribution, you want to create a pie chart that visualizes the item records by total sales quantity. Additionally, you want to generate a line chart that compares brands based on their average product ratings. You also want to search for records added from March 2023 to December 2025 and view product highlights of item records with the Logitech brand.
You also want to explore direct relationships and hierarchies. For example, you can explore the direct relationship between item and supplier records.
To achieve the goal, perform the following steps:
1Log in to CLAIRE GPT.
2Start a conversation to see all records in the Item business entity.
Enter the following prompt:
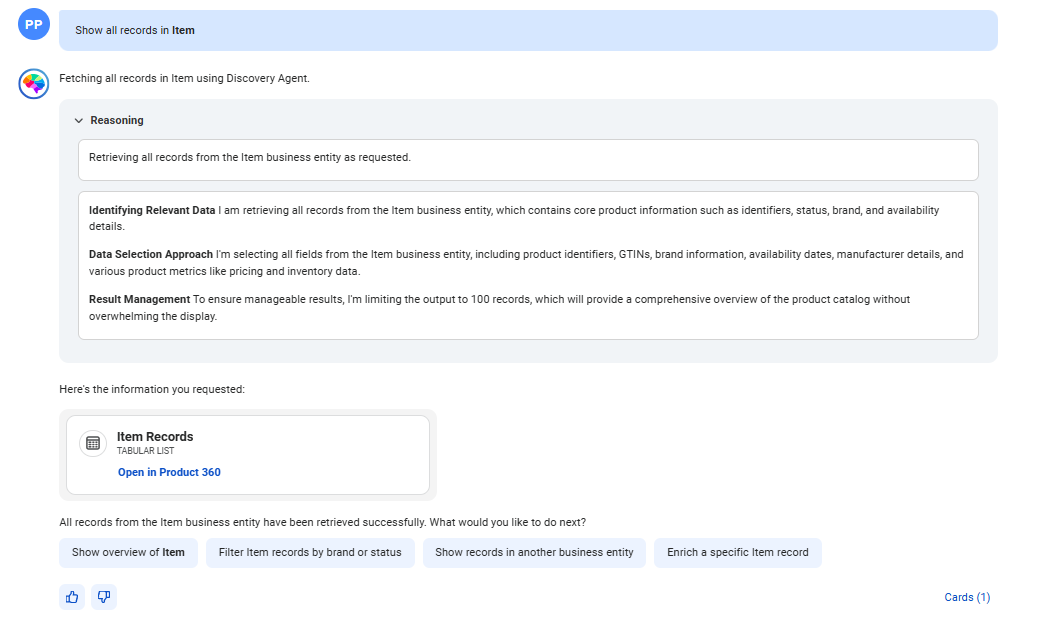
Show all records in @Item
The following image shows the response displaying a card containing all records in the Item business entity:
Using the data discovery agent, CLAIRE GPT also recommends prompt suggestions. You can select from the suggested prompts for further analysis.
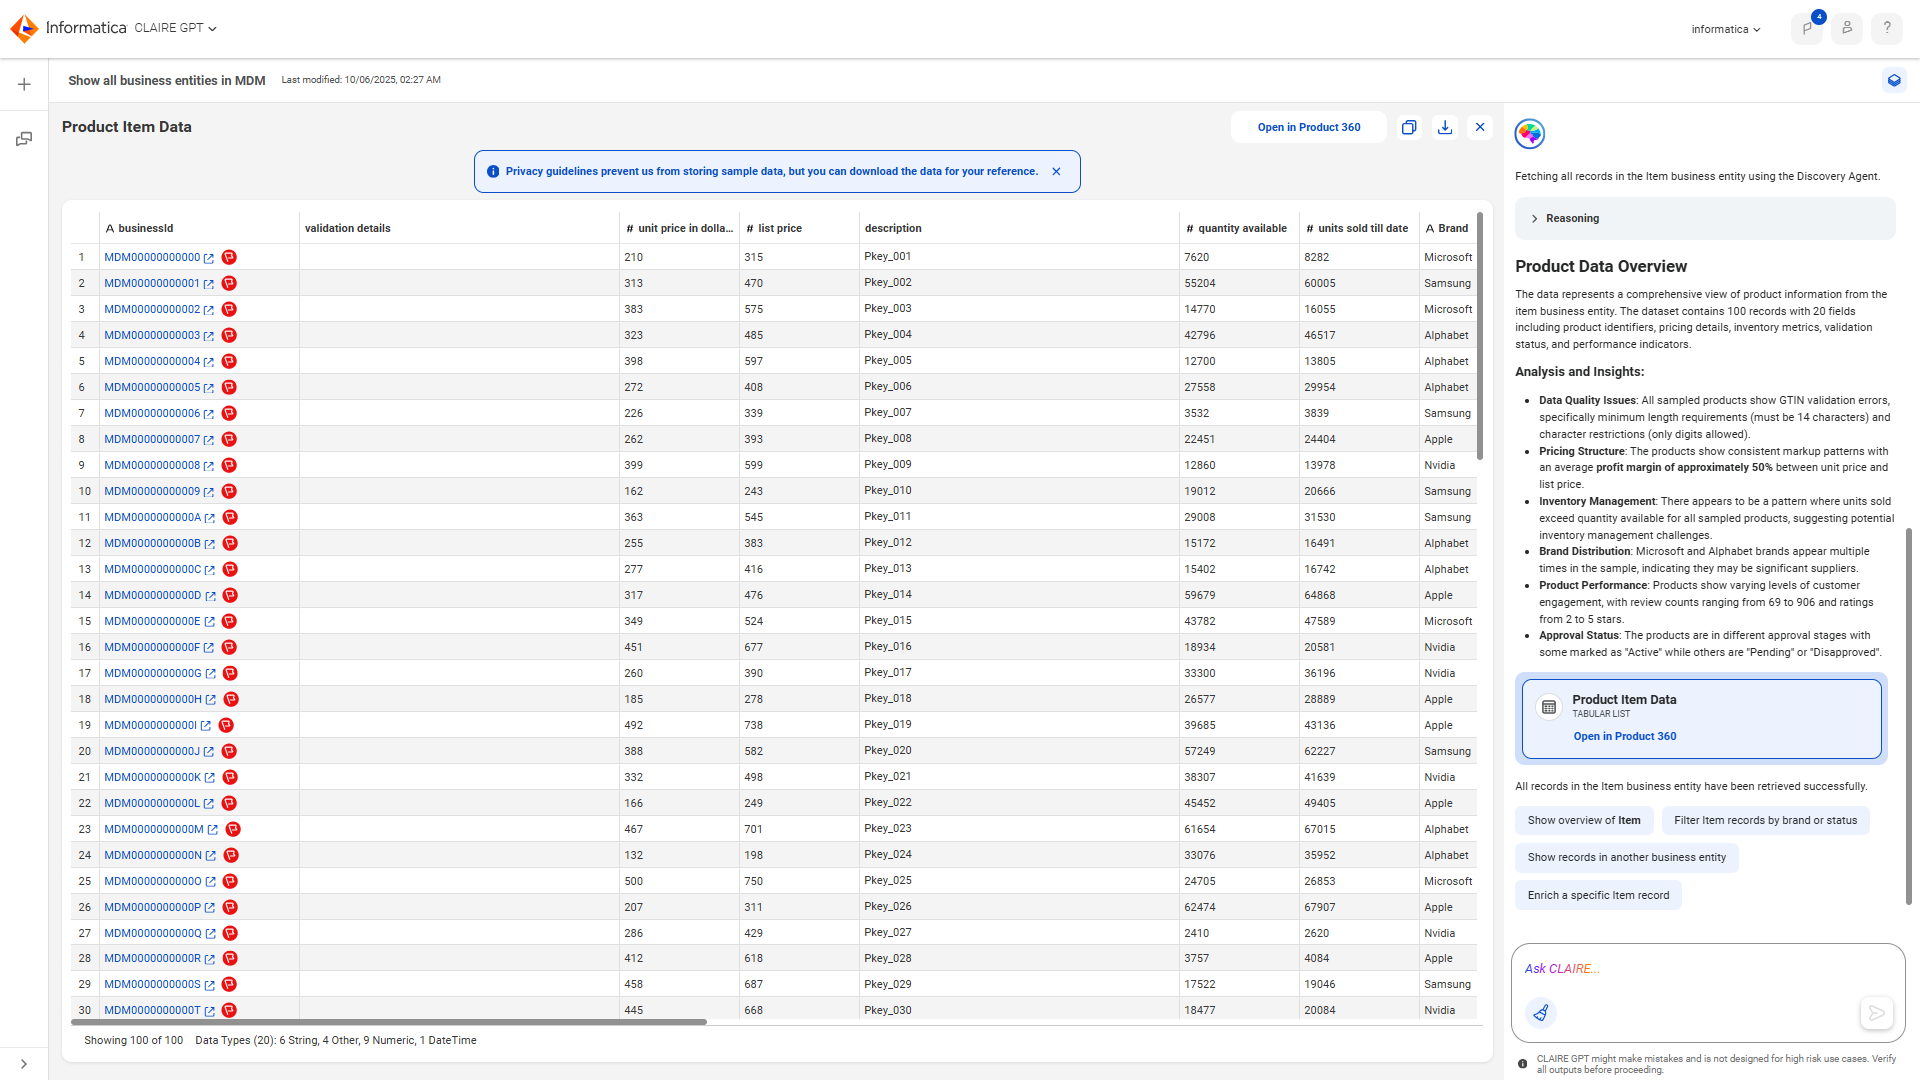
3To view all records in a tabular view, click the card named Item Records.
The following image shows the response displaying a tabular view of all records in the Item business entity:
You can click a business ID to view the record in Product 360 SaaS. You can also click Open in Product 360 to view all records in Product 360 SaaS.
Additionally, to copy and paste the sample data to a CSV file, click the Copy icon. To export the sample data to a CSV file, click Download. You can also navigate to the MDM SaaS business applications, such as Product 360 SaaS to view additional results.
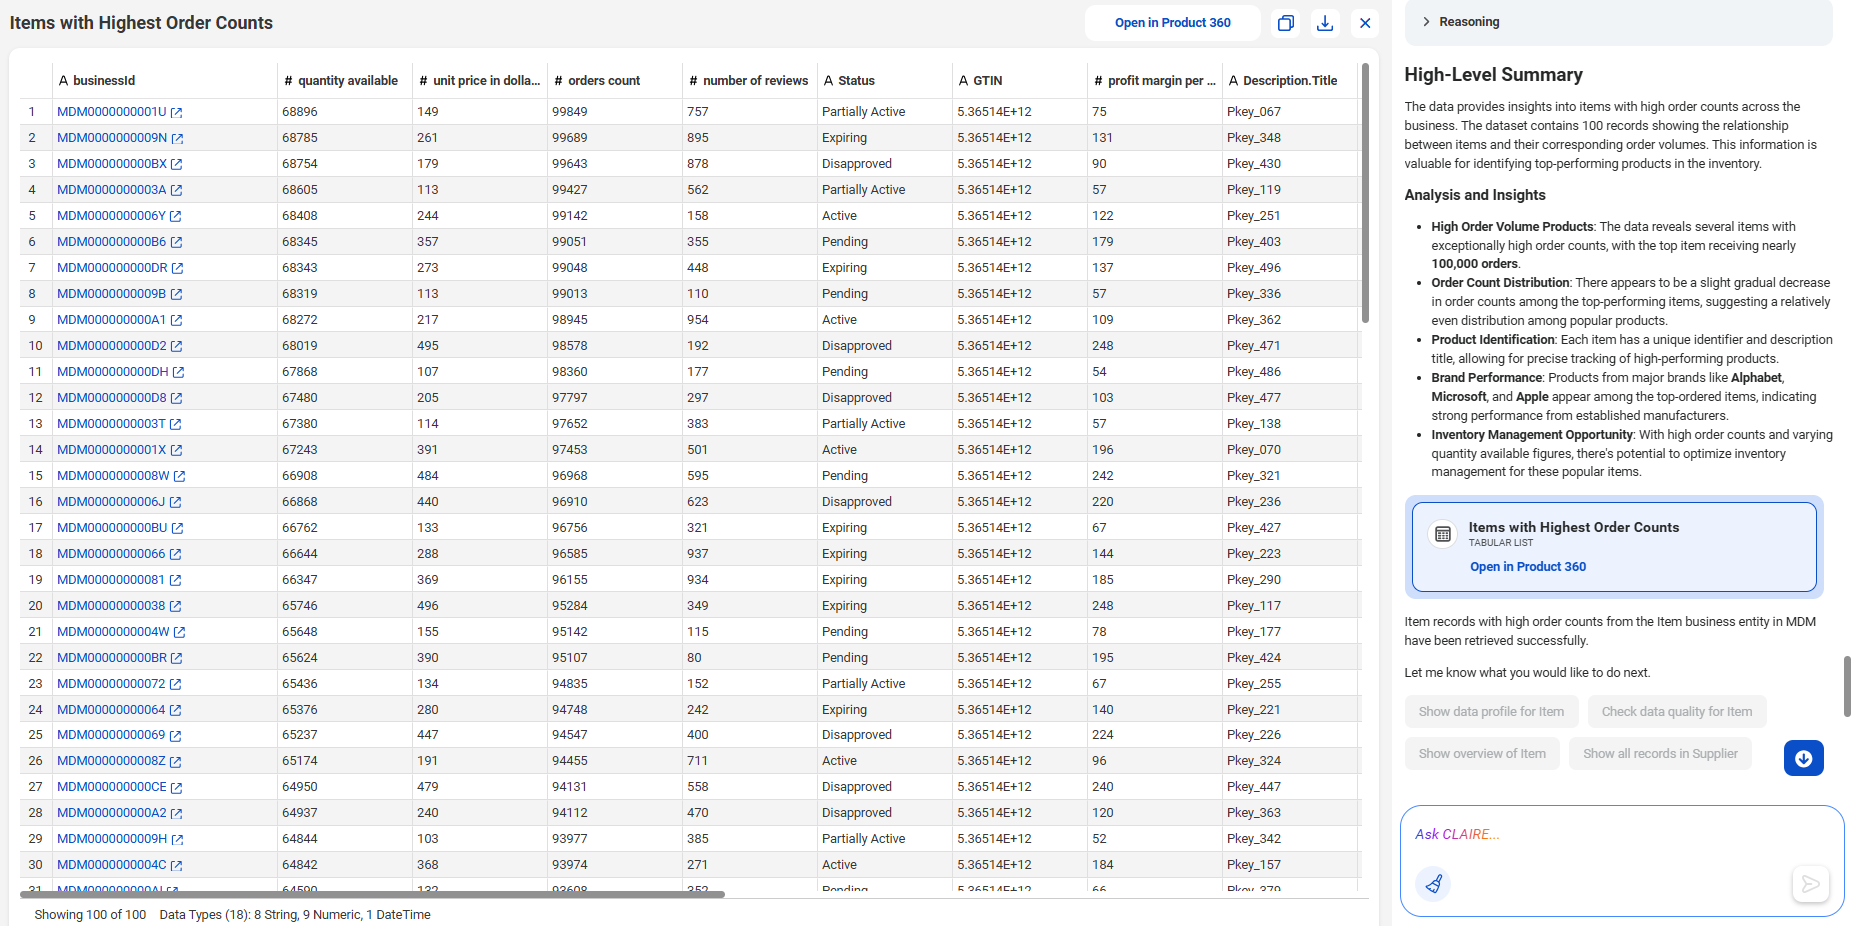
4To view the item records with high order counts, you can enter the following prompt:
Display Item records with high order counts.
The following image shows the response displaying a tabular view of all records with high order counts in the Item business entity:
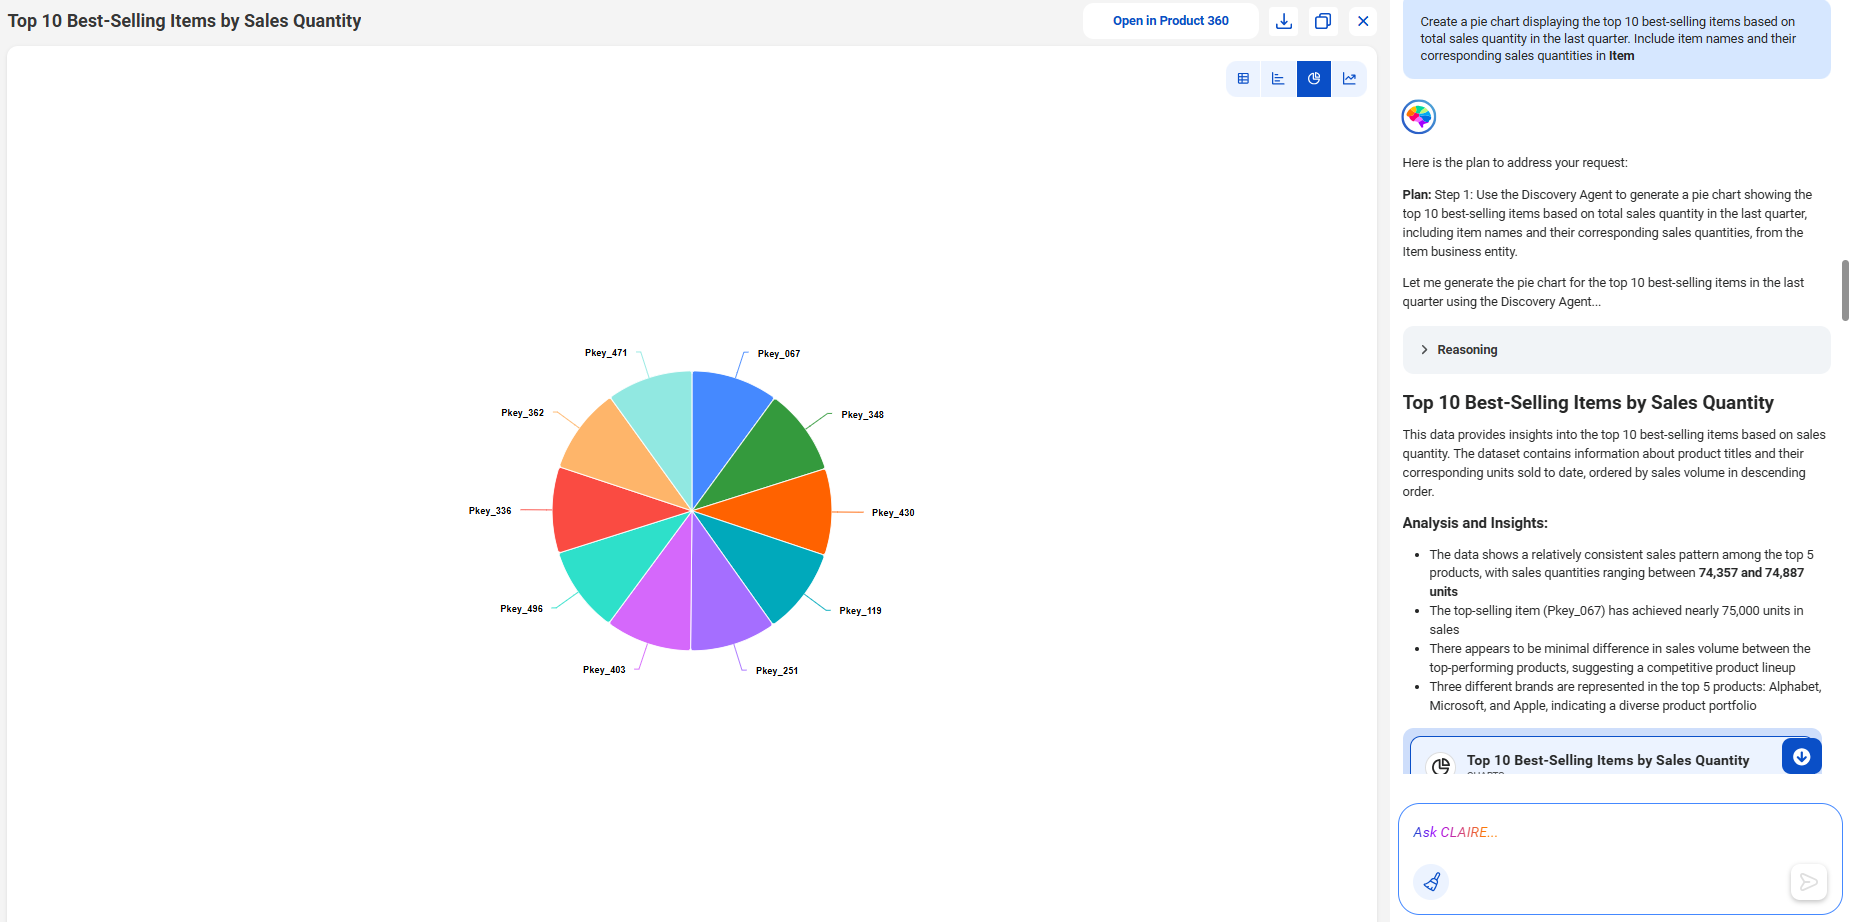
5To visualize the top 10 item records based on the total sales quantity, enter the following prompt:
Create a pie chart displaying the top 10 best-selling Item records based on total sales quantity in the last quarter. Include item names and their corresponding sales quantities.
The following image shows the response displaying a pie chart that represents the top 10 best-selling item records:
6To generate a line chart that compares items based on their brands and average ratings, enter the following prompt:
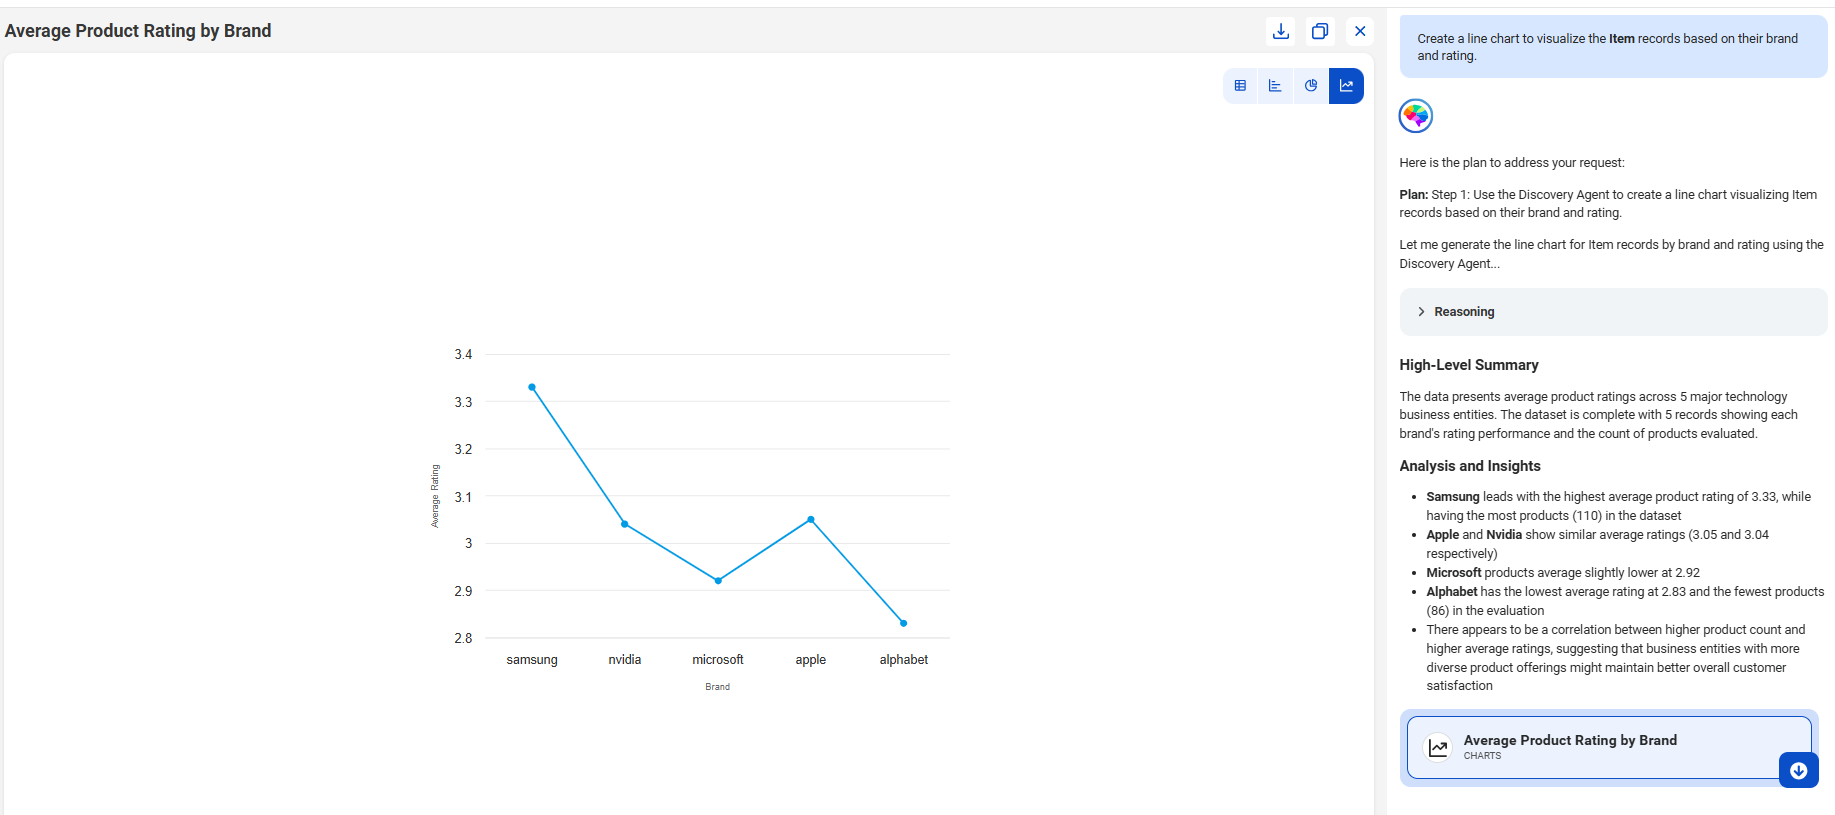
Create a line chart to visualize the Item records based on their brand and rating.
The following image shows the response displaying a line chart that represents the item records based on their brand and rating:
7To search for item records that were added between a specific date range, enter the following prompt:
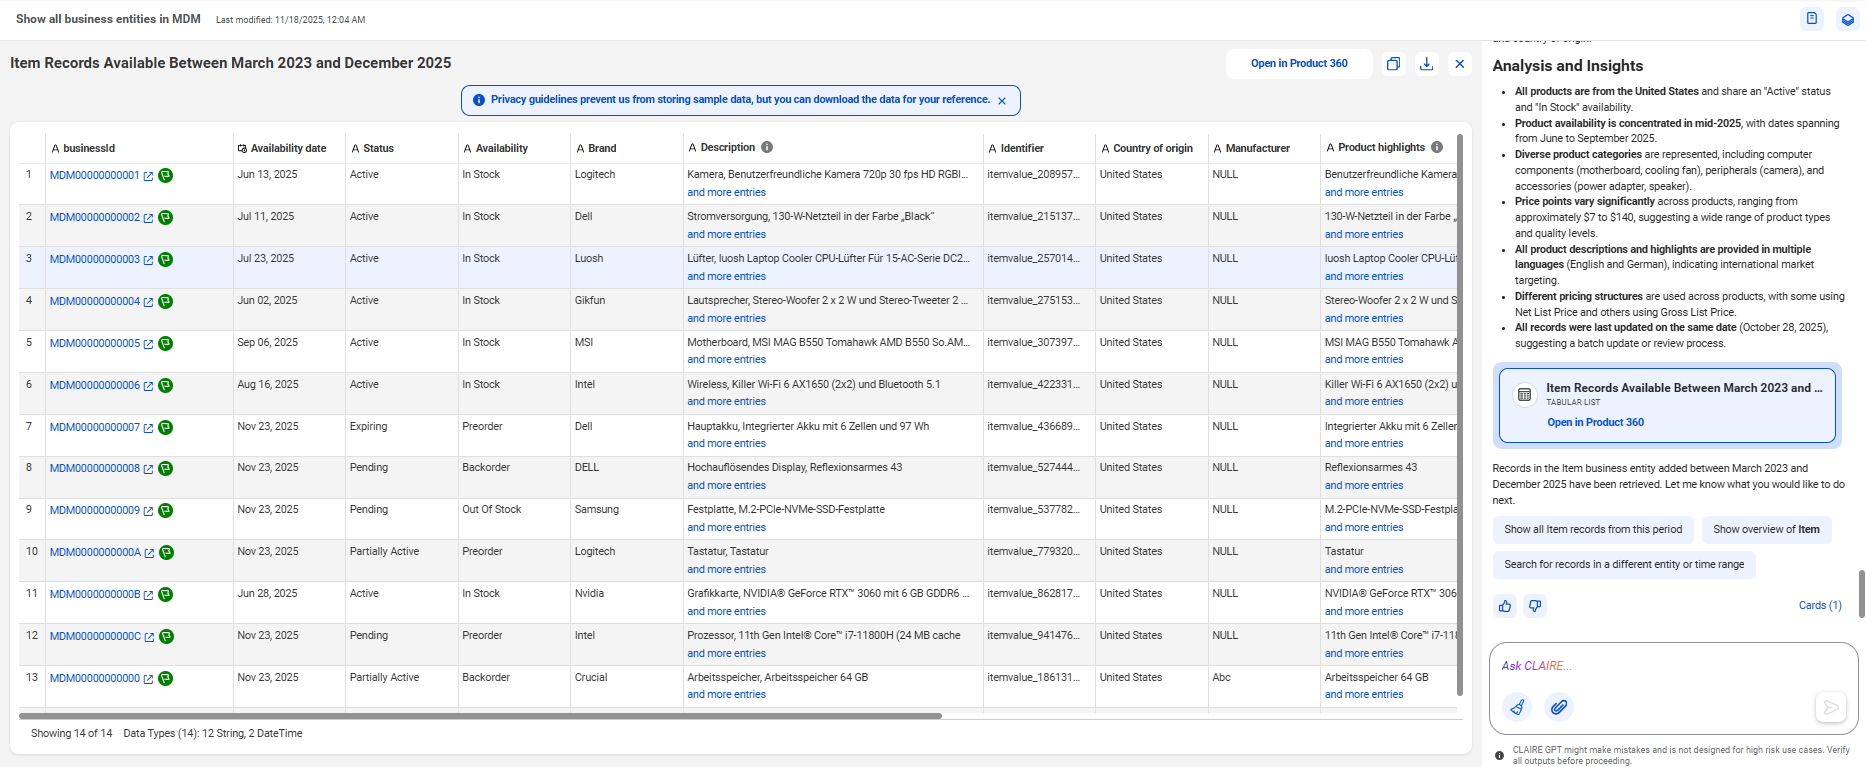
Search for records in @Item business entity added between March 2023 to December 2025.
The following image shows the response displaying all records in the Item business entity that were added between March 2023 to December 2025:
8To view all product highlights of item records with the Logitech brand, enter the following prompt:
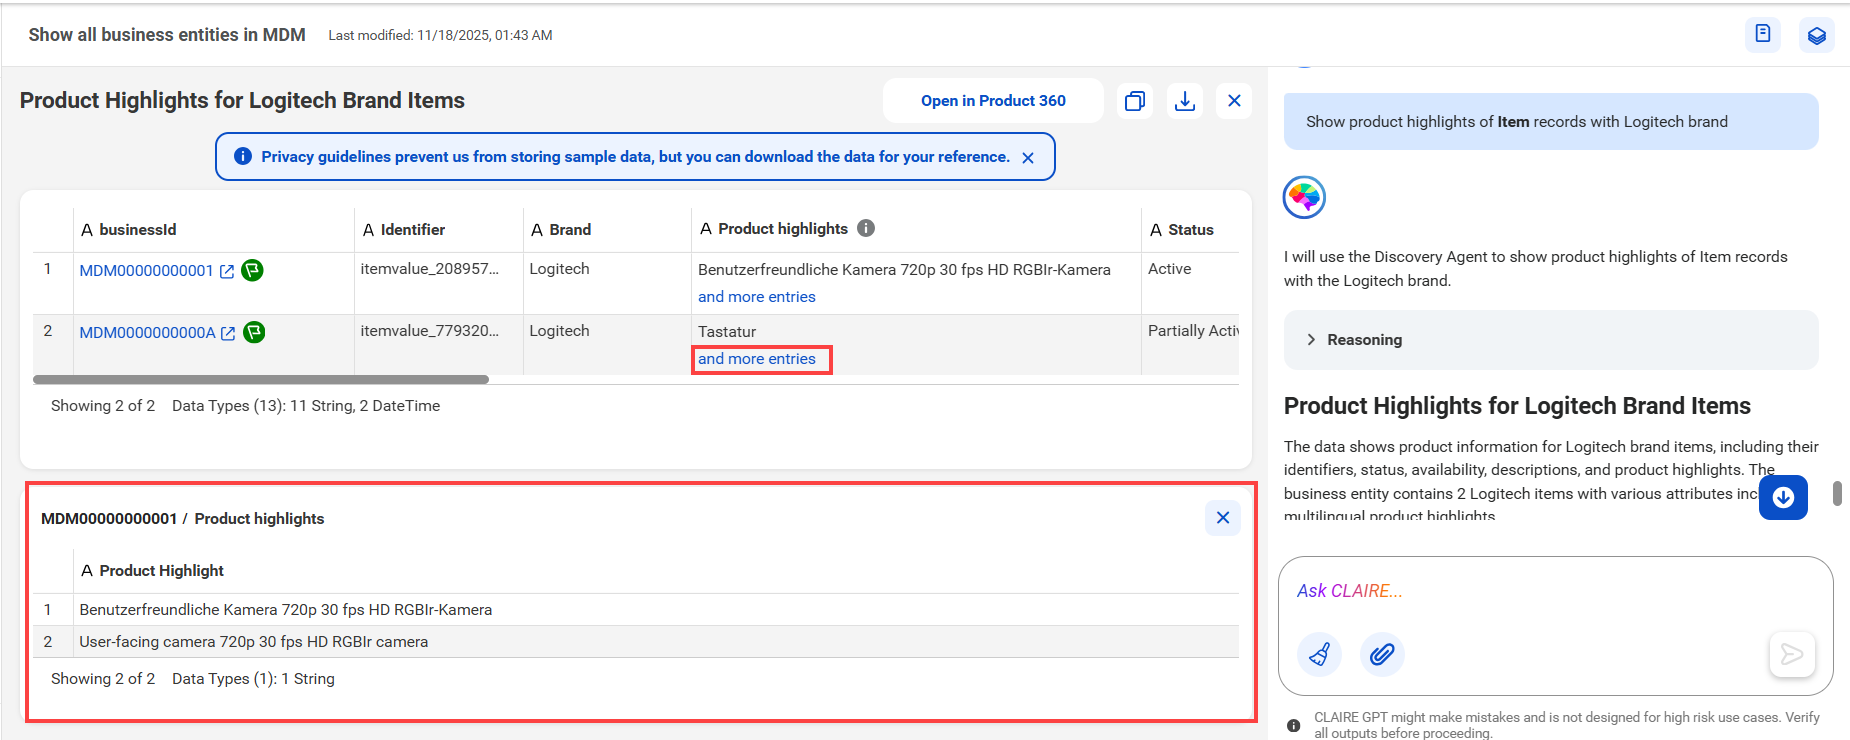
Show product highlights of Item records with Logitech brand.
The following image shows the response displaying product highlights of Item records with Logitech brand:
CLAIRE GPT displays the entry that matches the prompt and a link to view additional field group entries. When you click the link, the additional entries appear in a table.
If you want to continue your conversation in CLAIRE Copilot, click Open in Product 360 and open CLAIRE Copilot in MDM SaaS. You can use the same MDM SaaS prompts that you use in CLAIRE GPT.
9To view relationship between records from the Supplier business entity, enter the following prompt:
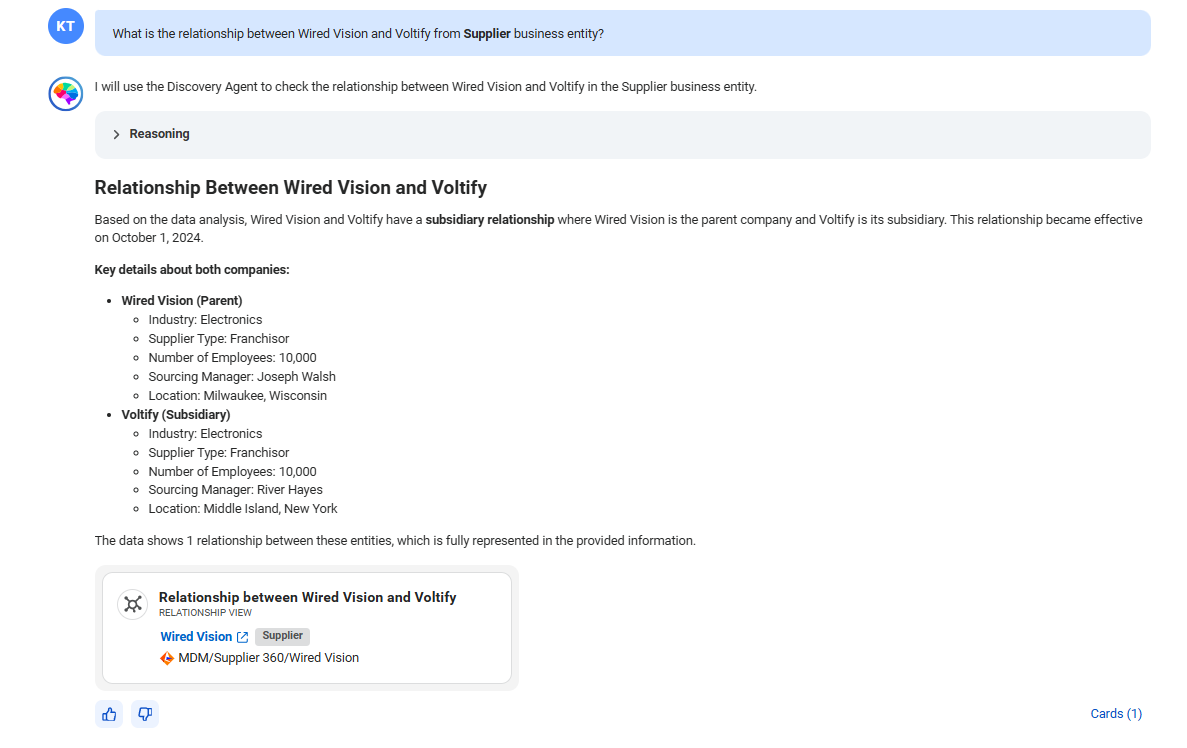
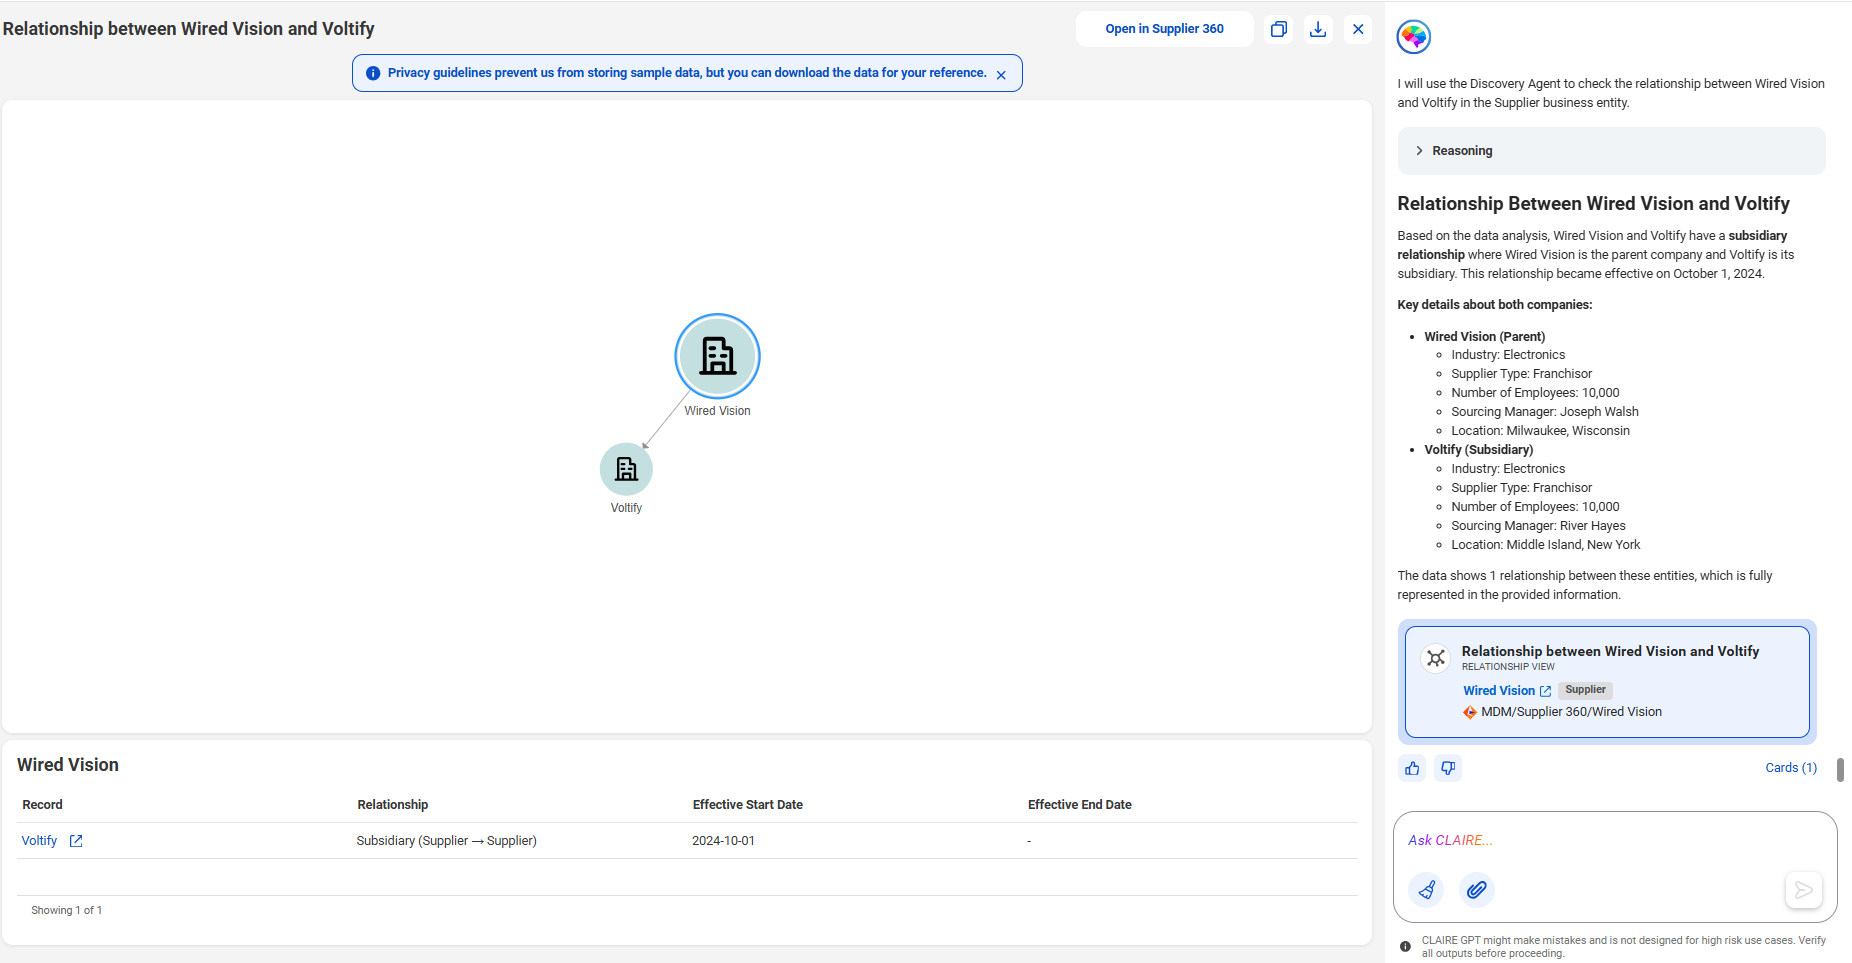
What is the relationship between Wired Vision and Voltify from Supplier business entity?
The following image shows the response displaying the relationship between Wired Vision and Voltify records:
CLAIRE GPT displays fields that aren't set as searchable for the relationship assets in the reasoning.
To view the relationship graph, click the card named Relationship between Wired Vision and Voltify.
The following image shows the response displaying the relationship graph of Wired Vision and Voltify records:
You can view the relationship graph and the details of the relationship in a tabular format. To view the record in Supplier 360 SaaS, click the record name or click Open in Supplier 360.
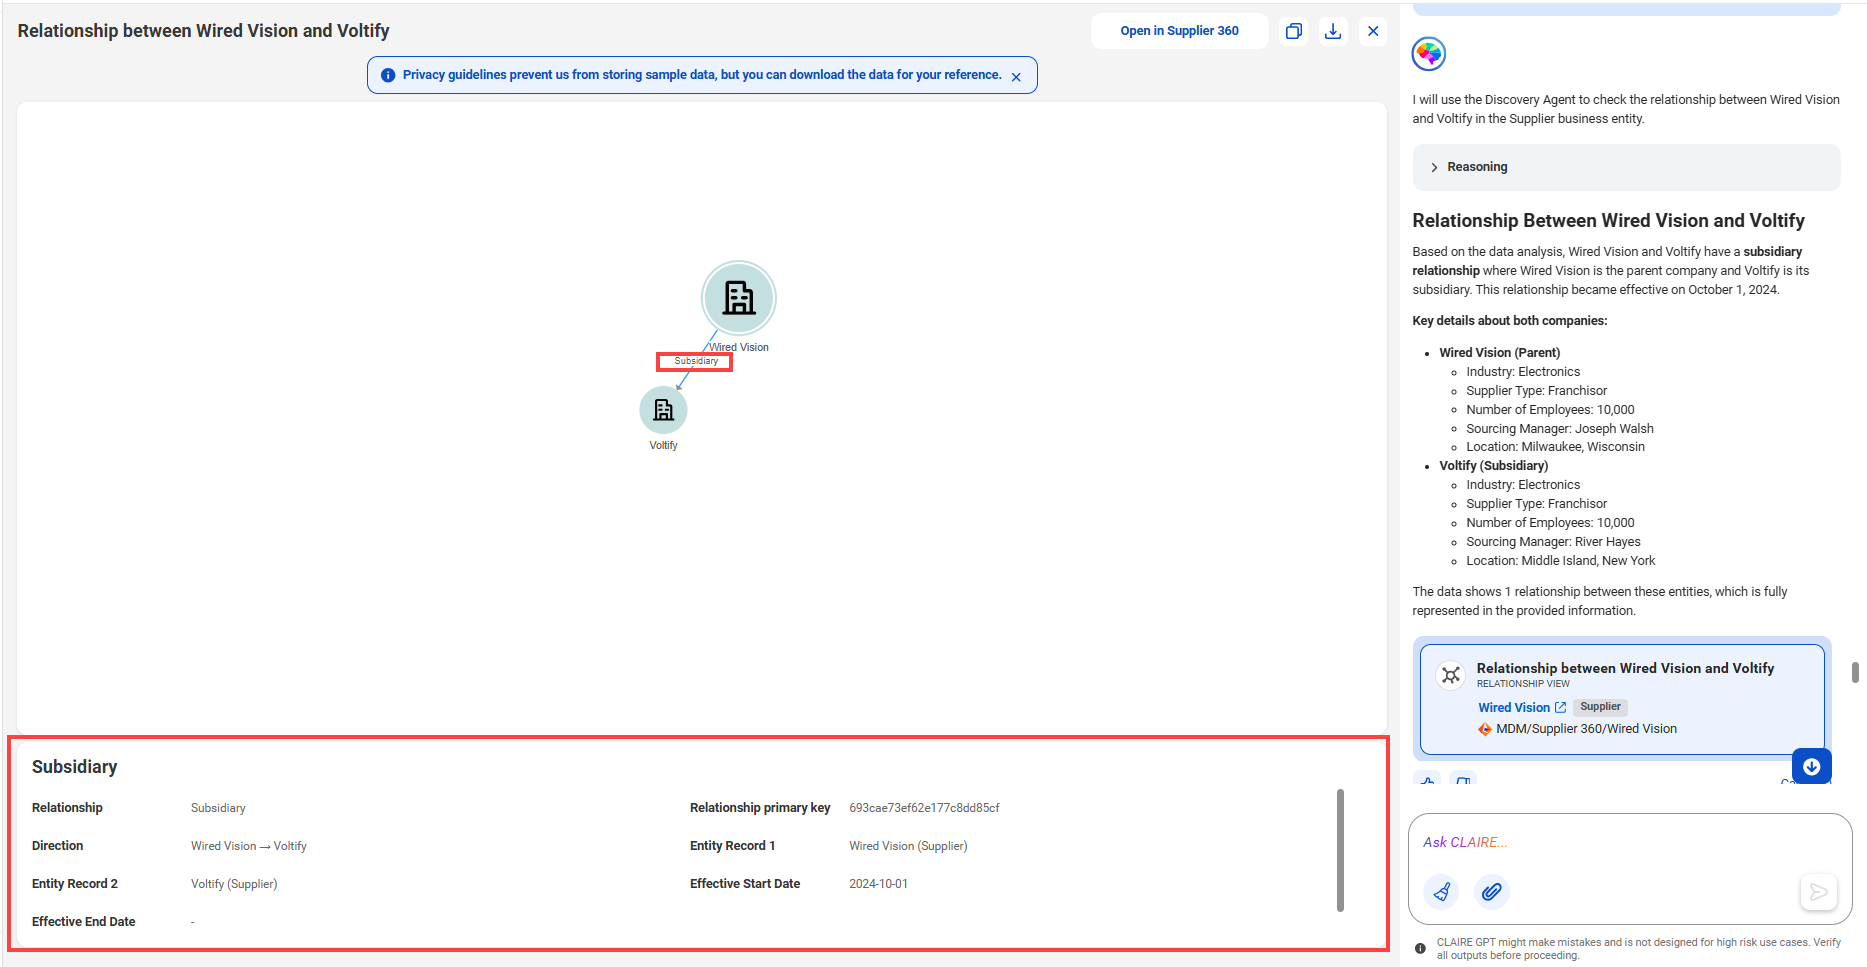
In the preceding example, Wired Vision and Voltify have a subsidiary relationship. The Wired Vision record is the parent company and the Volify record is its subsidiary. To view the relationship details, click the connection.
The following image shows the response displaying relationship details between Wired Vision and Voltify records: