Task | Description |
|---|---|
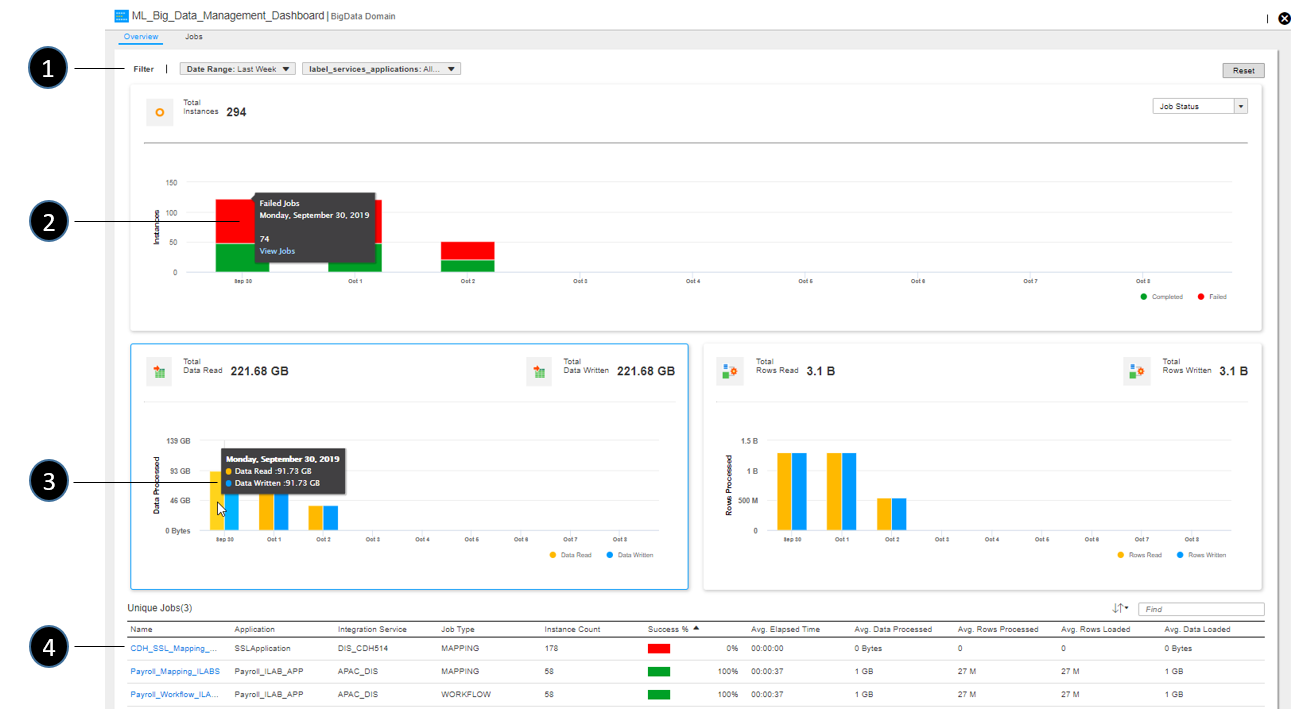
1 | Use filters to select the date range, Data Integration Service instances, and Hadoop clusters to view data for. The data displayed in the page is updated based on your filter settings. By default, data for the last seven days is shown for all Data Integration Service instances and Hadoop clusters in the domain. |
2 | In the Total Instances chart, choose whether to view jobs by job completion status, job type, or execution engine. Hover over a bar segment in the chart, and then click View Jobs to view details. |
3 | Move your cursor across the Total Data Read and Total Rows Read charts to view details for the time range specified in the filter. |
4 | Click a link in the Unique Jobs region to view details for unique workflows and mappings for the selected date range, services and clusters. See Viewing Data Engineering Integration job analytics for additional details. |