1Click All Infrastructure on the Operational Insights navigation bar.
The All Infrastructure page appears.
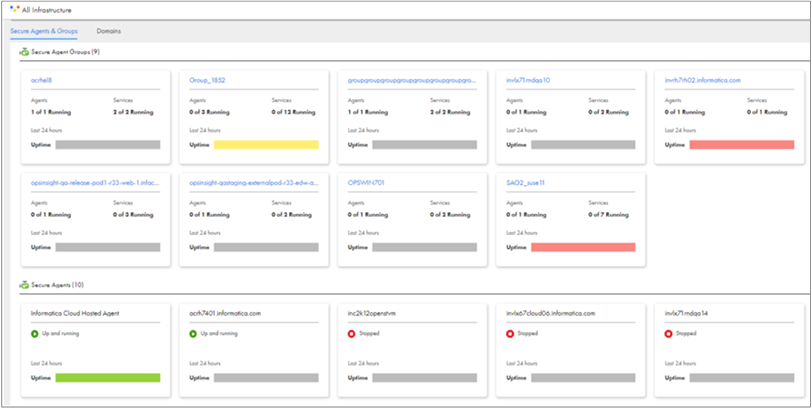
The following image shows the Secure Agents & Groups panel of the All Infrastructure page:

Hover over a Secure Agent group to view a list of all agents and services and their corresponding status in each runtime environment. Hover over an Uptime bar to view the status of all the Secure Agents according to their time range for the last 24 hours in each runtime environment. The status of the Secure Agents is shown by the following colors:
- - Green: all agents are running.
- - Yellow: at least one agent is running.
- - Red: all agents are down.
- - Grey: no data was captured.
Note: If a Secure Agent is stopped for over 30 days, the Uptime bar doesn't display data for the agent, and alerts about the agent aren't sent to email recipients. You must restart the Secure Agent to display data for the agent and to send alerts about the agent to email recipients.
2Click the name of a runtime environment, agent, or service in a Secure Agent group.
The Runtime Environment page appears. The page shows the status of the Secure Agents, the Secure Agent services, and jobs running in the environment.
The Resource Utilization graph shows overall resource utilization by services running in the runtime environment for the selected time period. The Resource Utilization: Disk Usage graph shows the daily amount of used and free disk space for the last month.
For information about using resource utilization graphs to view domains, see Monitoring on-premises applications.