1Click the Overview tab.
2Click a domain.
You might need to first select a location, then select a domain within the location.
3Click the Jobs tab.
A page displaying job runs loads.
4Use filters to select the job data to view.
The page updates according to your filter settings. By default, the page displays data for all jobs run over the last seven days.
5Click a job in the table to view details.
A page displaying statistics for individual job instances loads. Use filters to select the data you want to view. You can select additional columns to filter on from the Add Field menu.
6 Click a job in the table.
A graph displaying job run statistics loads in the page. You can view statistics by elapsed run time, amount of data processed, the amount of data read from source rows read, and the amount of data written to target rows. The charts display data based on the filters you set.
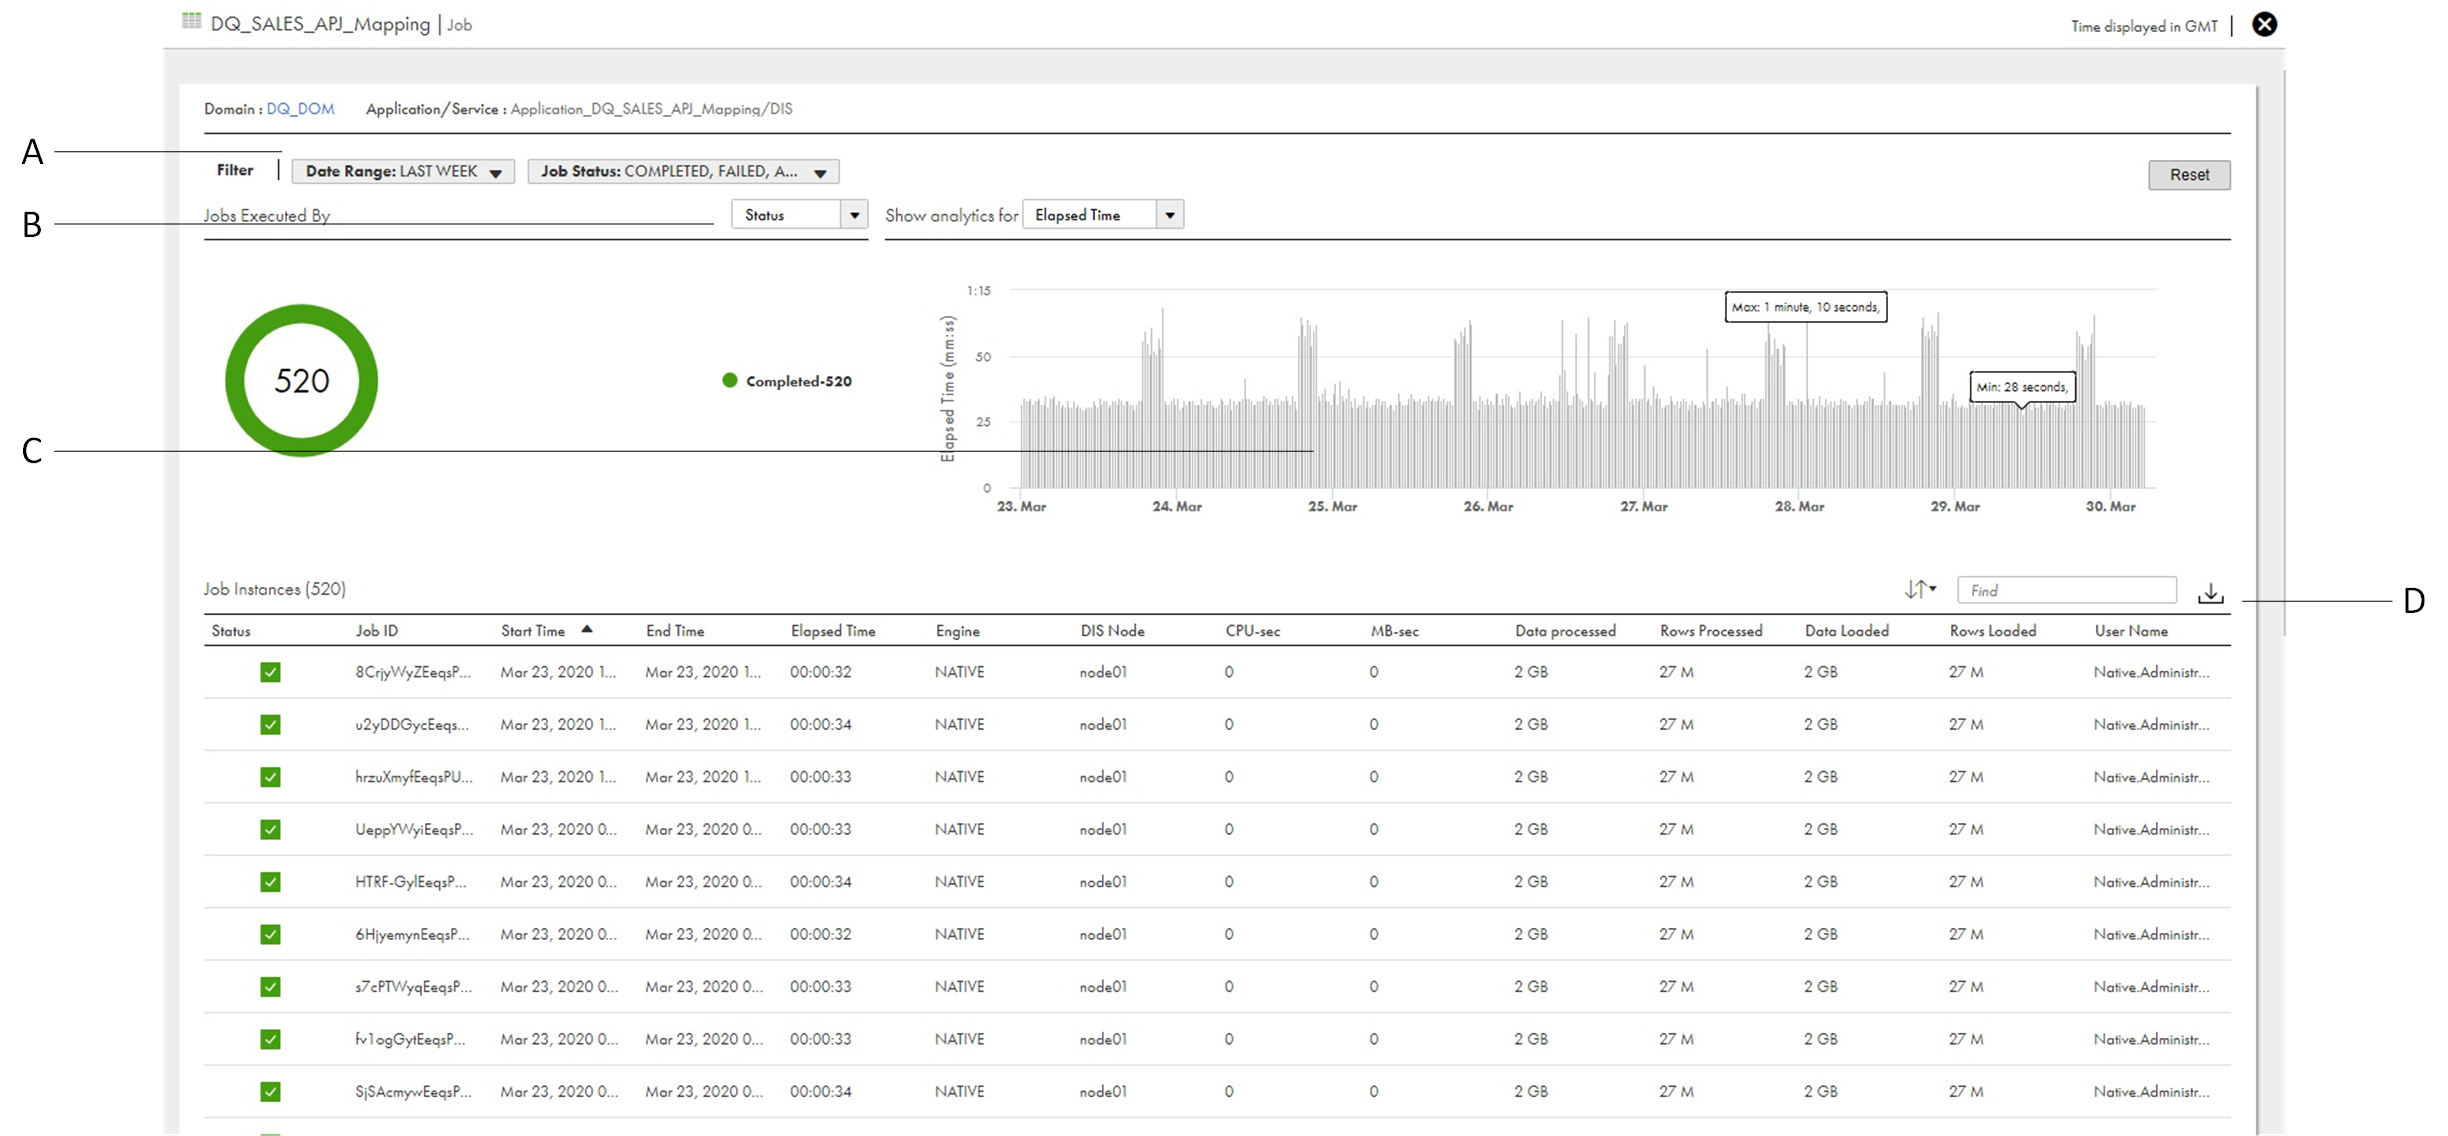
A. Use filters to select the job data you want to view.
B. Choose whether to view jobs by status or by execution engine.
C. Move your cursor across the graph to view specific details. You can zoom in on the graph to view details for a specific time frame. For more information, see Monitoring Informatica Intelligent Cloud Services.
D. Click the icon to download the table data to a comma-separated value (.csv) file.