Process Developer Perspective
The Process Developer perspective is the default product perspective and contains the views, editor, menus, and toolbars that support the tasks for designing and generating a BPEL process definition.
When you first launch Process Developer, you see its default window layout, called a perspective. A perspective consists of views, editors, menus and toolbars that support a set of tasks.
A view is a unique window within a perspective, designed for one task, such as displaying an XML tree view of a file, listing errors or tasks, or showing object properties.
Process Developer contains two default perspectives:
- •Process Developer Perspective
- •Process Developer Debug Perspective
Perspectives are versatile layouts that you can customize. See Customizing the Process Developer Perspective for details.
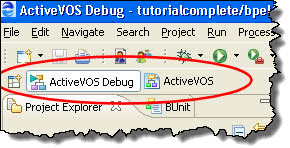
You can open and close perspectives using their icons on the Perspective Fast /View bar. The default position for the perspective bar is top right. As the following illustration shows, you can dock the bar in another location, shown here on the top left.
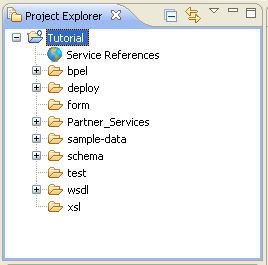
Project Explorer
The Project Explorer displays projects, folders, and files located in the Process Developer workspace folder. You must create a project before creating a BPEL process. An enhanced project type for BPEL is the orchestration project. For details, see Creating an Orchestration Project.
The Project Explorer's orchestration projects contain rich details and builders for working on BPEL processes and related WSDL, schema, sample data, test, and deployment files.
The Project Explorer is a mirror of the file system's Workspace folder.
We recommend you store all files within orchestration projects.
Tips for using the Project Explorer:
- •Add projects and files to the Project Explorer by dragging them in from the file system and adding an orchestration nature, which is described in Adding or Removing a Project Orchestration Nature.
- •Import projects and files. For more information, see Importing existing projects and Importing resources from the file system in the Workbench User Guide Help.
- •Copy and paste files from the file system.
- •Add files to the project workspace in the file system and then use the Refresh command to update the Project Explorer. For more information, see Workbench and Editing files outside the Workbench in the Workbench User Guide Help.
- •Use the many tools in the Project Explorer to filter, show, hide, and navigate through files. For more information, see Project Explorer view in the Workbench User Guide Help.
Participants
For details, see What are Participants?
Interfaces
By default, this view is not displayed. Instead, Participants view is displayed. You can display Interfaces by selecting Window > Show View > Interfaces. For details, see Interfaces, Service References, and Local WSDL.
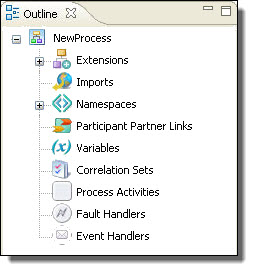
Outline View
The Outline view displays all major components of a BPEL process, as shown.
The nodes in the outline synchronize with the Process Editor and the Properties view. For example, select an activity in the Process Activities node to display the highlighted activity on the Process Editor canvas.
Tips for using the Outline view:
- •Right-mouse click on an item to add new items of the same type.
- •Reorder items by moving them up and down.
- •Reorder variables to reorder them in the Process Variables view.
- •Delete items you are not using.
- •Double-click variables and other components to open the main property, such as the Definition dialog.
Activities are added to the Outline in the order they are created, and the BPEL XML code reflects this order. You may find it helpful to reorder the Process Activities node into activity execution order.
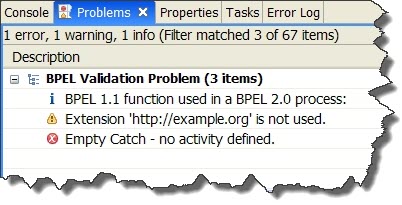
Problems View
The Problems view displays errors, warnings, and information related to the validation of your BPEL process. When you save your file, Process Developer performs static analysis on the BPEL file. This analysis validates the BPEL definition, expression language syntax, and WSDL references of the process, and adds items for invalid activities to the Problems view. Before testing your process, you can correct invalid activities.
As you correct errors and warnings, the related items in the Problems view disappear. You can also set a preference for levels of information you want to see in the Problems view.
The following illustration shows several errors and one warning for BPEL processes in Process Developer.
Tips for using the Problems view:
- •Double-click an item to go to the associated resource.
- •Right-mouse click an item to view property details or to select Go To resource.
- •Group problems by type or severity.
- •Use the extensive Configure Contents feature.
Tasks View
The Tasks view displays to do items you add. Add an item from this view, or right-mouse click on an activity on the Process Editor canvas.
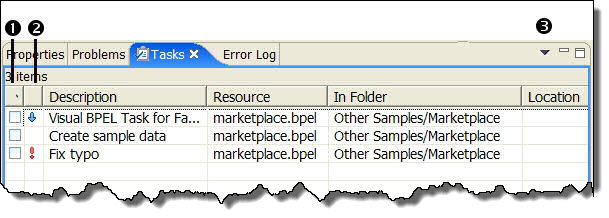
The following illustration shows an example of the Tasks view.
1 | Check box for a to do item, indicating complete or incomplete. Check the box when the item is complete. Click the column header to sort by completion. |
2 | Priority for a to do task, including high, normal, and low. Click the column header to sort by priority. |
3 | Select display, sort, and filter criteria |
Tips for using the Tasks view:
- •Double-click a task to go to the associated resource.
- •Right-mouse click a task to view property details or to select Go To resource.
Thumbnail View
If you design a complex process, it can outgrow the canvas display quickly. You can display the Thumbnail view to make navigation in a large process easier.
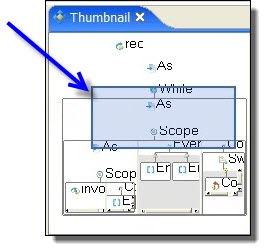
The Thumbnail view shows a miniature representation of your process. The section of the process currently showing in the Process Editor is shaded by a blue box. When a complex process cannot be fully displayed, move the blue box in Thumbnail view to display a selected area.
To display the Thumbnail view, select Window > Show View > Thumbnail.
To view another section of the process, click on the Thumbnail view shaded box, and move the box. The corresponding section of the process on the canvas moves into view. The following image shows this shaded box:
Bookmarks View
The Bookmarks view displays a list of bookmarks that you added to a BPEL process or a service file.
Add a bookmark to a BPEL activity or a service file to create an easy way to link back to the information. You can select a bookmark from the list and go to the place where you added the bookmark.
In the default perspective, Bookmarks view is not shown. To open this view, select Window > Show View > Bookmarks.
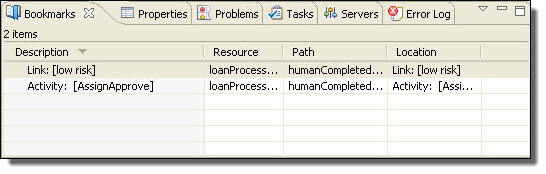
The following illustration shows an example of the Bookmarks view.
Double-click a bookmark to highlight its location on the Process Editorcanvas. For more details on bookmarks, see the Workbench User Guide help.
Relationships View
Open this view by selecting Windows > Show Views > Relationship View.
This view shows you a graphical representation of dependencies and references of BPEL, WSDL, XSD, and other artifacts in relation to the file open in the editor. Using this view, you can track the location of WSDL and XSD imports and other artifacts that are in the workspace.
For example, if a BPEL file is open, you'll see a relationship diagram of the files that the BPEL file depends on, such as WSDL, XSD, and HTML. You can select another file to see its dependencies and references.
You can toggle the view by using the toolbar buttons, Show Dependencies and Show References.
Servers and Console Views
The Servers view allows you to configure and start up the Process Server that is part of the Process Developer installation. You can deploy processes to the server and then execute them and remote debug them.
When you select Start the Server in this view, you can see the start up messages in the Console. The Console view shows messages from the Tomcat servlet under which Process Server runs.
For details of starting up and using the embedded engine, see Setting Up the Embedded Process Server.
Status Bar
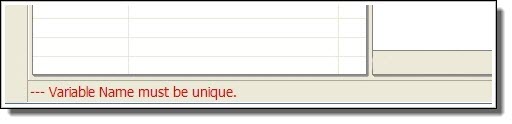
The Status Bar shows the information about current actions and error messages. The following illustration shows an example of an error message in the Status Bar.