Process Monitoring
The Monitor menu in the Process Console provides access to process, task, and server monitoring options that include:
- •Active Process: View the list of process instances that have been or are currently executing.
- •Alarm Queue: View a list of active 'On Alarm' Process activities.
- •Receive Queue: View a list of active receive, onMessage, and onEvent activities queued for incoming messages.
- •Dispatch Service: View details for services governed by the DispatchThrottle policy. You see this option only if you use an agent console.
Active Processes
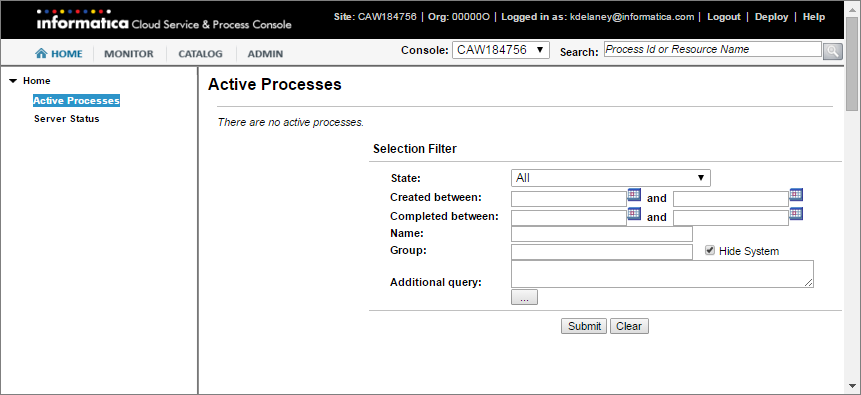
The Active Processes page shows a list of process instances that are executing or completed, along with the process version. States can be Running, Suspended, Completed, Compensatable (for a subprocess), or Faulted.
From the Monitor menu, choose Process Monitoring > Active Processes.
Select filter criteria to select specific processes. For a Secure Agent, you can also show/hide system processes. For the Cloud Server, you have an option to hide/show both system and public processes.
Click Submit to view all processes or those that meet the filter criteria, if any.
After you submit the selection options, a list of Active Processes displays, as shown here for a Secure Agent:
Alarm Queue
Under Selection Filter, select these Alarm Queue options to determine which process activities appear when you view active alarms in the On Alarm list:
Option | Description |
|---|
Deadline Between | Beginning and Ending date and time for alarm. |
Process ID | Process instance ID. You can find this ID on the Processes page. |
Process Name | Local part of the process-qualified name (qname) . |
Group | The Group this process belongs to (optional). The Group name displays in the On Alarm list. |
Hide System | Uncheck to display the default System processes. The System processes are hidden by default. |
Receive Queue
Use the controls on this page to set the size for how many queued receives to hold in memory to reduce the number of queries to the database. Sizing depends on server memory constraints.
The information on this page is as follows:
- Unmatched Correlated Receive Timeout
The amount of time (in seconds) that the engine waits for a correlated message to be matched to a receive activity. This is only if the message arrives before the activity becomes active. If a correlated message takes longer than the specified time to be matched, the engine discards the message and you see a correlation violation exception
The default value is 30 seconds. To avoid many unconsumed messages on the server, set this value to a low number. If you set this value to specify zero seconds, the engine discards all unmatched correlated messages immediately.
When you click the Clock icon, you see the duration-chooser dialog box.
For more details, see Server Properties.
- Unmatched Correlated Receive Count
The maximum number of unmatched correlated receives the engine will hold in memory at a time. When this limit is crossed, the engine rejects unmatched correlated receives; starting from the oldest, to make room for newer receives.
- Queued Receive Cache Size
- The size of the cache memory that holds activity information when the system is busy with other requests.
You can also change any of the values displayed for these three fields.
If events are displayed, select a receive and then select a partner link to view details. A window opens where you can see the BPEL process location in which the receive activity executes. You can also see the correlation property alias and data, if any, associated with this receive activity
Dispatch Queue
Use the dispatch service to create dispatch configurations that throttle requests made to Process Server.
The requests could be HTTP/S messages, message events, or other Transport Layer Security (TLS) requests. You can queue requests, dispatch requests in batches, and control the maximum number of requests that run concurrently.
For example, you have a frequently used process that quickly dispatches asynchronous requests to Process Server. At runtime, if thousands of these requests execute simultaneously, the result can overwhelm the server and the service being invoked. Use the dispatch service to send requests in batches and to ensure that only a few requests are processed at the same time.
You can use the dispatch service for services that run on the Secure Agent. You cannot use the dispatch service for services that run on the cloud server.
Create a dispatch configuration for a service or process group. At runtime, Application Integration chooses the dispatch configuration in the following order of preference:
- 1. Service Name
- 2. Process Group
- 3. System Default
For example, the service processA_event1 has the following dispatch configurations that apply to it:
- •processA_event1 (Service Name)
- •GroupABC (Process Group)
- •SystemDefault
When Process Server executes processA_event1, the processA_event1 dispatch configuration applies.
The dispatch service applies to all requests except for subprocess invokes that contain boundary events. For example, if a subprocess step contains a message event, the dispatch service will not apply to the subprocess.
However, if you use a service call step to add a subprocess, the dispatch applies to all subprocess configurations, including subprocesses with boundary events.
Default and Custom Dispatch Services
Process Server has default dispatch services.
The following table shows the default dispatch services and their purpose:
Default Dispatch Service | Purpose |
|---|
SystemDefault | Applies to all services. |
avBusinessConnectionRESTService | Applies to service connectors. |
avCreateAnyEntityService | Enables the host runtime to PUT records using a database connection. |
avDeleteAnyEntityService | Enables the host runtime to DELETE records using a database connection. |
avHostEnvironmentRuntimeAccess | Enables the host runtime to access records using a database connection. |
avHostRuntimeCall | Enables the host runtime to GET records using a database connection. |
avProxyToProcess | Enables a process to call other processes as a services. |
jmsEnqueueService | Applies to the JMS automated step. |
sfHostEnvironmentRuntimeService | Enables the host runtime to access a Salesforce database using a Salesforce connection. |
To create a custom dispatch configuration, go to Server Configuration and select a Secure Agent. Then, go to Queues > Dispatch Queue.