Server Monitoring
After pressing the Server Monitoring command, Process Server displays the following page:
Process Server monitoring includes:
- •Server Statistics: (Agent only) View server monitoring statistics
- •Deployment Logs: View process deployment logs
- •Server Log; View and manage the server log
- •System Performance: (Agent only) View runtime metrics
Server Statistics
Note: You only see this command if you have selected an agent.
Use the Statistics page to view the monitoring properties you configured or which are the default. Process Server collects engine statistics and then aggregates them by intervals. If desired, you can configure a threshold interval and an error/warning level for each of these properties. If you configure these settings, you will see additional signals displayed on this page, such as an eyeglass icon indicating a property is being watched.
During a collection interval, Process Server maintains statistics for each configured property value, including the maximum, average, and total count values. In addition, historical statistics are collected. Historical statistics include minimum and maximum values for the intervals being recorded. Statistics are collected in-memory.
Select Reset to clear statistics. For example, if you correct an error condition, you can reset the statistics collection starting with zero values to see if performance improves. Once all errors and warnings are cleared, the engine monitoring level is reset to Normal.
Deployment Logs
The Deployment Logs tab shows a list of logs generated when new and modified business process archive (.bpr) files are deployed.
The following image shows a sample Deployment Logs tab :
The number of errors and warnings generated, if any, are shown.
On this page you can:
- •Change the display of the logs list by using the Selection Filter
- •Select a .bpr file to view its deployment log
After you click on a .bpr file, Process Developer displays its Deployment Log page. This page has the name, date, and log for the selected .bpr file.
During deployment, the engine validates the deployment descriptor of the BPEL process, ensuring that the its WSDL file and other resources are available and valid for the current version of the process. If validation errors or warnings occur, make corrections and redeploy the .bpr file or create a new .bpr file for invalid processes.
Note: When you delete a contribution, its deployment log is also deleted.
Selection Filter
- 1. Select the Log Contents type, if desired.
- 2. Select Deployed between dates, if desired.
- 3. Type in the Name of a .bpr file, if desired. You can use a wildcard (*) in the name.
- 4. Select Submit. The Deployment Logs list redisplays based on your selection filters.
Server Log
The Server Log captures events occurring on the server so that you can view and troubleshoot problems. For each event, the log includes the time, problem level, source (initiator), service (event type), engine, and message describing the event. For example, a BPR deployment causes a log event with info level, system source, engine service.
Note: The server log may not update immediately after an event occurs. It is typically updated between 30 and 60 seconds after an event. If you are not seeing what you think should be there, you may just need to update your browser.
The following image shows a sample Server Log:
This topic discusses:
- •Server Log Information
- •Deleting the Process Server Log
- •System Logging for WebLogic Users
Server Log Information
One of the following filters was used when generating logging information:
- •Log Time (Logged after and Logged before). By default, the log displays the most recent six hours of events. Refresh the page to view the most recent date and time. You can change the log period by setting the date and time. As a time shortcut, you can select the Now icon at the end of the time text box.
- • Level. One of the following was selected:
- - Verbose—All levels
- - Info
- - Warning
- - Error
- - Critical
- • Source. The initiator of the event or select All. Sources are:
- - System—Process Server events such as deployments
- - Maintenance—Storage and deployment log deletions
- - User—User-initiated
- • Service. The services are:
- - Alert—Alert service configuration events
- - Email—Email service configuration events
- - Engine—Engine events, including deployments, Process Server start/stop, storage events, monitoring alerts
- - Identity—Identity service (file, LDAP, JDBC) configuration events
- - Messaging—Messaging service (JMS or other) configuration events
- - Task.—Client URI update events
- - Process—Messages added to Process Server Log from a process using the Process Server Log Comment system service
- - All—All services are shown
- • Engine Name. The engine upon which execution occurred.
- •Message . Text describing the event.
The console records the User/IP address when a purge or scheduling request occurs. An application server may have its own method. Here, for example, is what might be shown for Tomcat: https://tomcat.apache.org/tomcat-7.0-doc/api/org/apache/catalina/valves/RemoteIpValve.html.
Deleting the Server Log
Use the Clean Up Storage on the Storage tab of the Server Configuration page.
In addition, the interface for clearing the server log is available in Process Developer as a system service so that a developer can create and deploy a process to delete the log programmatically.
System Logging for WebLogic Users
If you are using WebLogic, you must enable system logging from the WebLogic Process Console to have the Process Server stdout write to the WebLogic server log.
- 1. In the WebLogic Process Console, select the Logging top-level tab.
- 2. In the General sub-tab, enable Advanced options'
- 3. Select the Lock & Edit button so you can make changes.
- 4. Enable the Redirect stdout logging enabled checkbox.
- 5. Choose Activate Changes to apply your changes
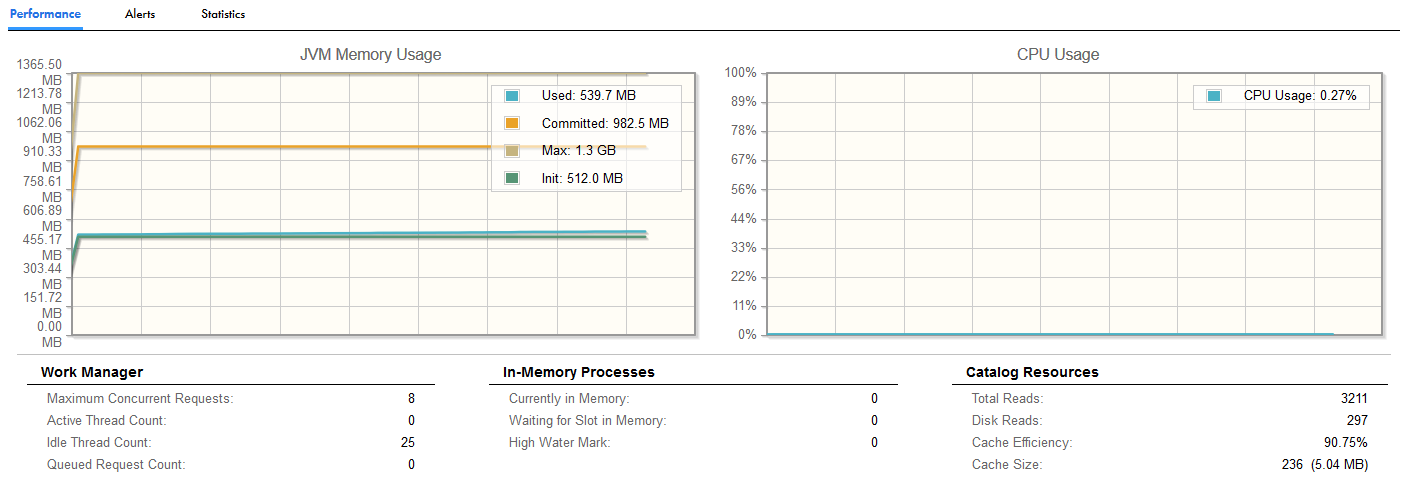
System Performance
You see these details on the Performance tab:
- •Overall performance data.
- •Performance and throughput of service requests.
- •Resource and service bottlenecks.
For example:
The statistics show a snapshot of what was in memory when you first open the page. Refresh the page to get updates.
These statistics let you ask questions such as:
- •How many requests are being sent to the server?
- •How long is the queue?
- •How many requests are waiting?
- •How long does it take to provide a response?
- •How long is it taking for the server to return from service calls?
- •Should I increase the work manager limits set on the Server Properties page?
After you run a load test, you can watch the metrics and set or reset configuration properties.
Platform Support
As you analyze performance in relation to your application server, keep the following in mind:
- •Statistics important to consider before changing other settings include:
- - CPU Utilization—graph over time interval
- - JVM Memory Usage—graph over time interval
- - Database Connection Pool—available, in use, waiters, and high water marks