Debugging Request Forms With debug=true QueryString
At some point during development, you may need to debug Process Central forms and scripts. To begin debugging, Process Central must:
- 1. Switch off the Form Cache: Process Central caches forms downloaded from the Process Server catalog. When a form (HTML, script or both) is updated and deployed to the catalog, you will need to logout and login again so that Central will clears its cache and downloads the latest version of the HTML form (instead of using an older version). Switching off the cache forces Process Central to bypass the cache.
- 2. Split Form HTML and Scripts: A Process Central form consists of HTML content inlined with JavaScript code. When the form is loaded into the browser, it is not easy to debug (for example, you cannot set breakpoints in the code) the JavaScript since the code is run in anonymous eval() functions and is not visible (or easy to find). To work around this issue, the browser must load the JavaScript (that is embedded in the form) as a separate resource (file).
You can do this if you load the Process Central page with debug=true in the query-string (for example, http://localhost:8080/activevos-central/avc/avc.jsp?debug=true). When the page is loaded with debug=true, Process Central by-passes the forms cache and downloads HTML forms from Process Server for every single request (that is, it always fetches the latest copy). It also serves the JavaScript embedded in form as a separate resource to the browser. Making available the inline JavaScript as a separate resource lets you set break points in your code using a script debugger such as FireBug (for FireFox), Developer Script Console (for Chrome), or Developer Tools (for Internet Explorer 8).
The scripts in FireBug JavaScript debugger are available for debugging using the Script tab. The following figure shows a Request form named applyForLoan_avc_req1 (which is a runtime name; the actual name in the HTML is applyForLoan$ID) listed in FireBug's script menu. If you do not see the script associated with a specific form, press the up and down arrow keys (on the FireBug UI) to scroll through the list of available scripts.
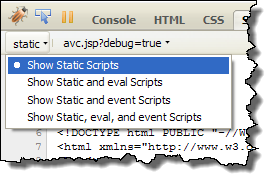
If you see too many scripts, (for example, eval() functions), narrow down the list of scripts that is displayed to 'static' files. This option is available in the left drop down menu in FireBug:
Finally, the following FireBug figure is at a break point in the loan application form JavaScript code.