Summary Statistics
The Summary Statistics view shows information about the Data Integration Services and the objects that a Data Integration Service runs.
Use the Summary Statistics view to view summaries of object distribution, object state, and Data Integration Service resource usage for a specified time range. You can view statistics for the domain, or by Data Integration Service or application.
You can view statistics about the following objects:
- •Ad hoc jobs. Jobs that users ran from the Developer tool or the Analyst tool.
- •Deployed mappings and workflows. Mappings and workflows that are deployed in an application.
- •Requests and connections. Deployed SQL data services and web services.
- •Resource Usage. CPU and memory usage of the Data Integration Service processes that are running in the domain or on a node in the domain.
For example, you can view all of the jobs in the domain that failed over the last eight hours. You can review resource usage for that time range to see if the jobs failed due to resource issues on the node.
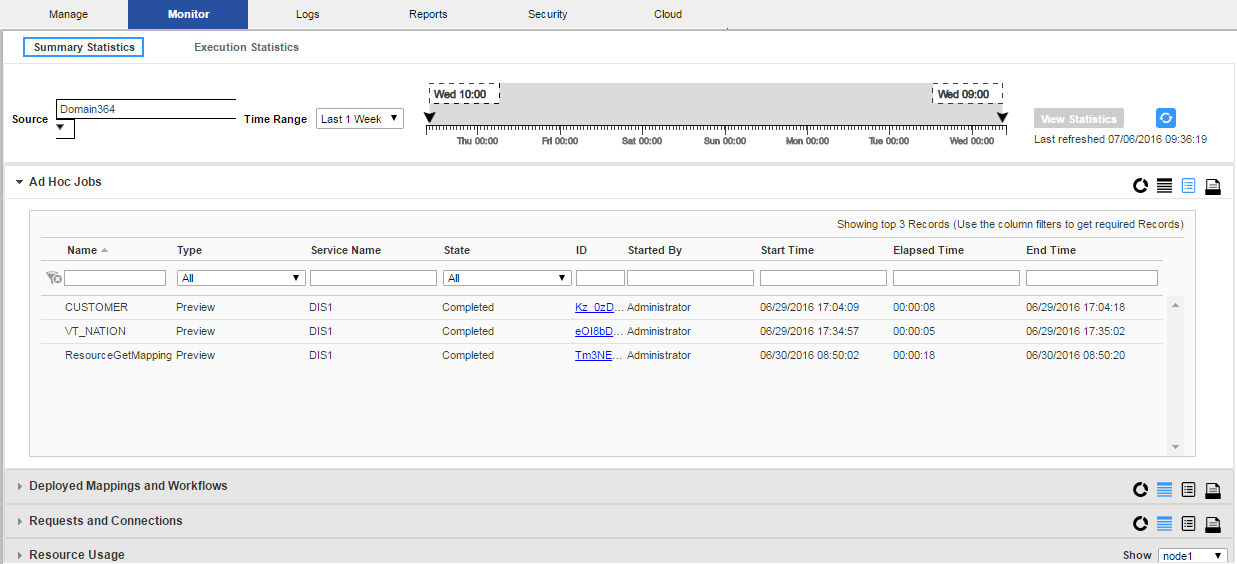
The following image shows the Summary Statistics view with a list of ad hoc jobs in the Details panel:
When you select a source and time range you can choose one of the following options to view the data:
- •Graphical distribution. Displays doughnut and line charts that summarize object distribution and resource usage for a time range. The doughnut charts show distributions of objects by state, type, and the Data Integration Service that ran them. The line charts compare resource usage for the Data Integration Service that ran the jobs to resource usage for all of the processes that ran on the node during that time range.
- •Tabular distribution. View the total completed, running, canceled, aborted, and failed jobs.
- •Details. View a list of the jobs, requests, or connections that comprise the summary statistics. You can click the Job ID to view the specific job in the Execution Statistics.
- •Export data. Export the detail data for a specific object type to a .csv file.
The Summary Statistics view displays statistics using data that is stored in the Model repository. You must configure a Model repository in the Monitoring Configuration before you can view Summary Statistics.
Viewing Summary Statistics
You can view summary and detail information about ad hoc jobs, deployed mappings and workflows, requests and connections, and resource usage for Data Integration Services in the domain.
1. Click the Monitor tab.
2. Click the Summary Statistics view.
The time line appears.
3. In the Source field, choose the source for which you want to view statistics.
4. In the Time Range field, choose the time range for which you want to view statistics.
5. Optionally, choose Custom to specify a custom time range.
6. Click View Statistics.
The object and resource usage panels appear.
7. Expand an object type to view statistics for that object type.
8. Select whether to view a graphical distribution, a tabular distribution, or a detail list of the data. Or, choose to export a .csv file.
9. Optionally, you can perform the following actions in the Resource Usage panel:
Option | Description |
|---|
Show | Show all nodes or one node. |
Click the magnifying glass | Enlarge the chart. |
Drag | Zoom in on a section of the chart. |
Reset Zoom | View the chart at the default size. |

