Informatica Administrator
This section describes new Administrator tool features in version 10.1.
Domain View
Effective in 10.1, you can view historical statistics for CPU usage and memory usage in the domain.
You can view the CPU and memory statistics for usage for the last 60 minutes. You can toggle between the current statistics and the last 60 minutes. In the Domain view choose Actions > Current or Actions > Last Hour Trend in the CPU Usage panel or the Memory Usage panel.
Monitoring
Effective in version 10.1, the Monitor tab in the Administrator tool has the following features:
- Details view on the Summary Statistics view
- The Summary Statistics view has a Details view. You can view information about jobs, export the list to a .csv file, and link to a job in the Execution Statistics view. To access the Details view, click View Details.
The following image shows the Details view:
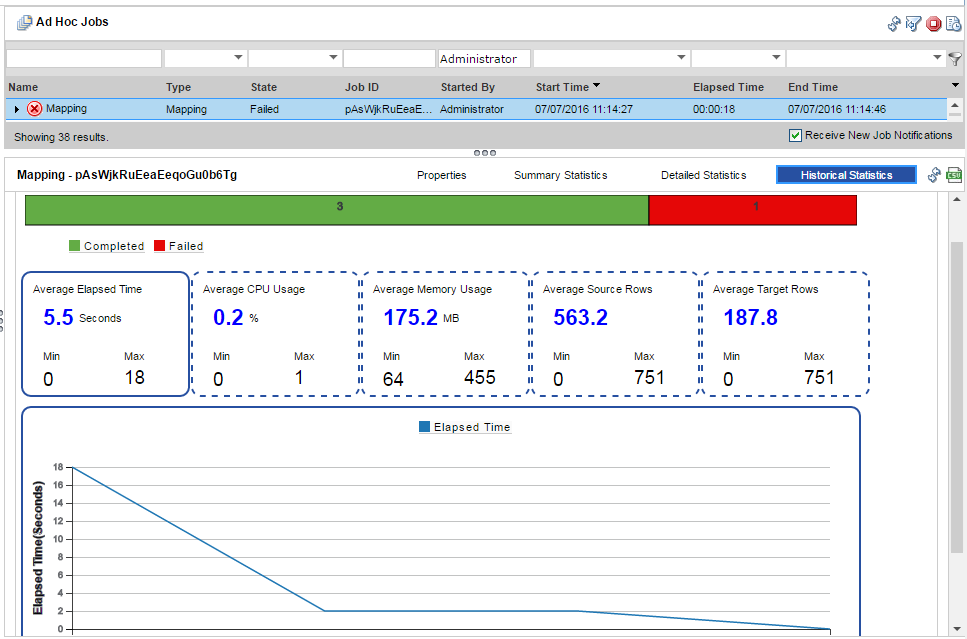
- Historical Statistics view.
- When you select an Ad Hoc or a deployed mapping job in the Contents panel of the Monitor tab, the Details panel contains the Historical Statistics view. The Historical Statistics view shows averaged data from multiple runs for a specific job. For example, you can view the minimum, maximum, and average duration of the mapping job. You can view the average amount of CPU that the job consumes when it runs.
The following image shows the Historical Statistics view:


