View Asset Relationship
You can click the Relationships View tab after you open a business term or policy in the Glossary workspace. You can see a visual representation of all the assets that are related to the asset that you opened. Glossary consumers can use the relationship view to see related assets.
You specify relationships between assets when you define the asset. For example, a policy governs a business term. In the relationship view, the Analyst tool shows a diagram that represents the relationship between the business term and policy.
Asset Relationship Diagram
When you open the Relationships View tab of a business term or policy, the Analyst tool displays a diagram of the asset relationships. The Analyst tool updates the diagram based on your interaction with the relationship view.
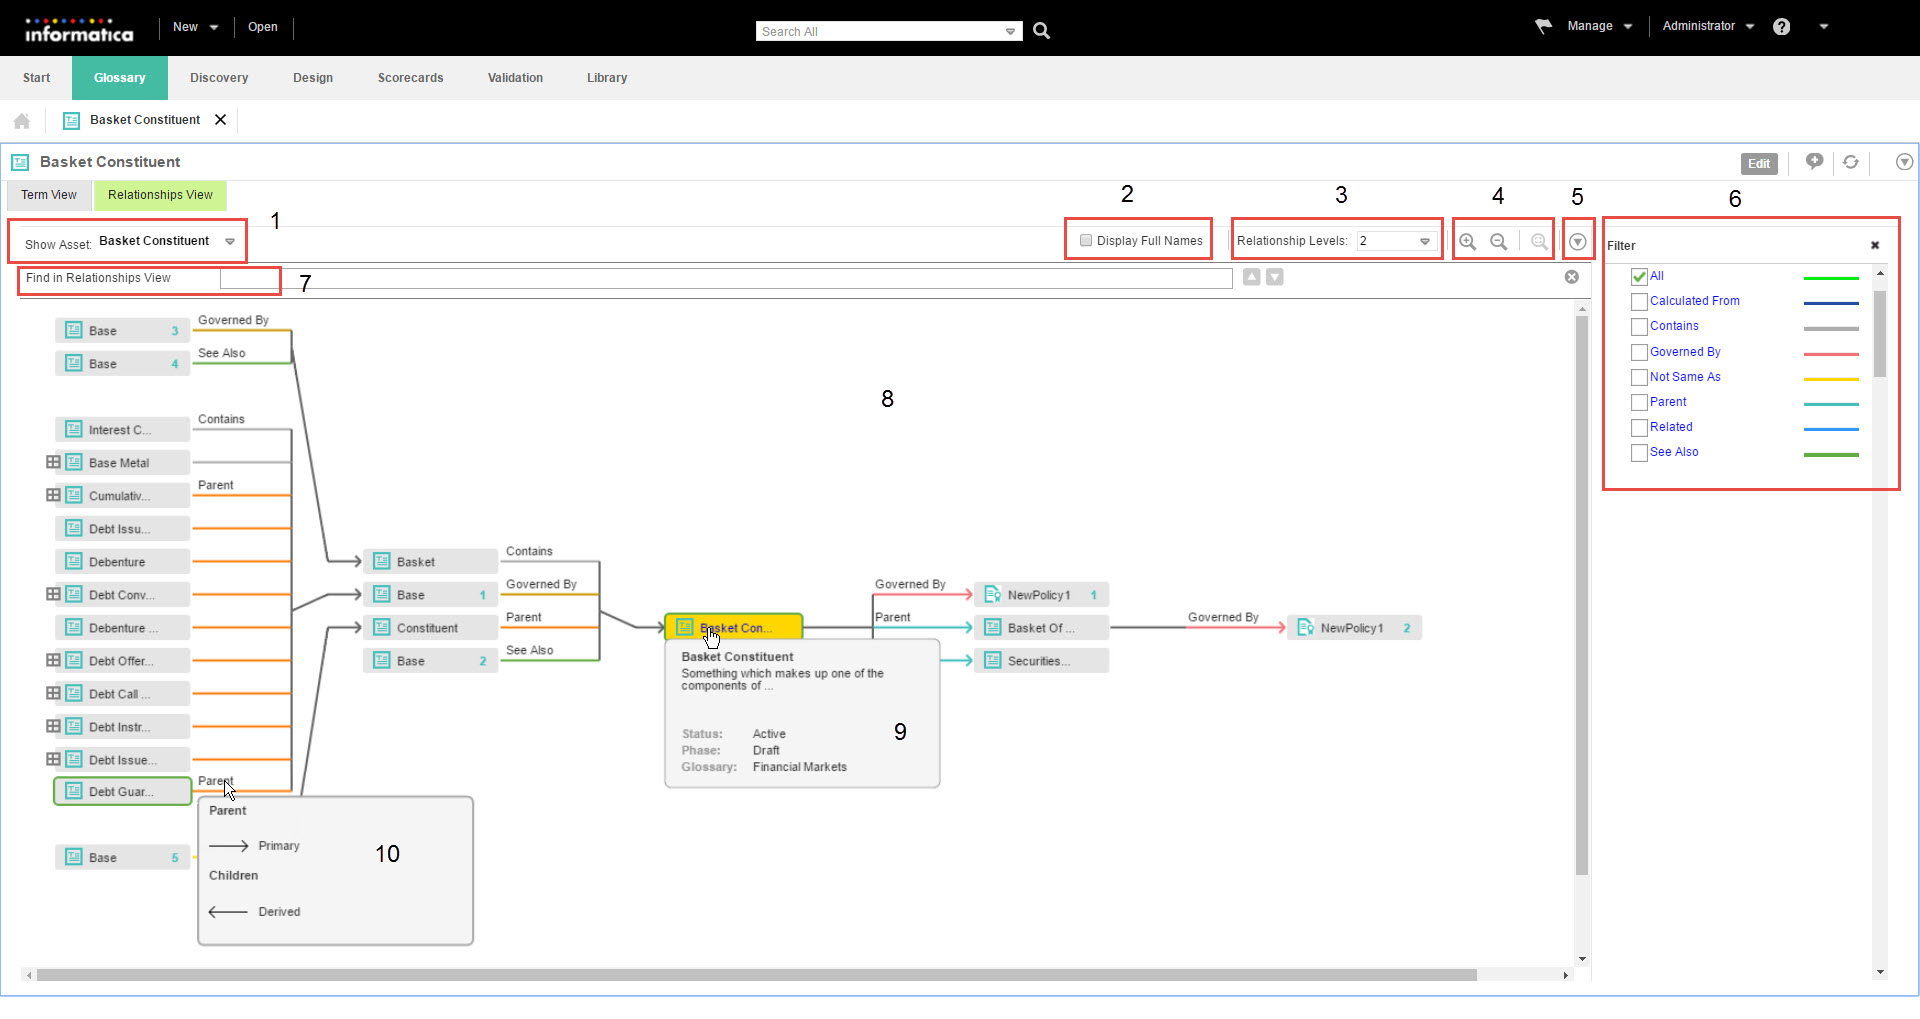
The following image shows the relationship view diagram:

- 1. View asset history.
- 2. Display full asset names and relationship names.
- 3. Change view level.
- 4. Zoom in, out or restore to original size.
- 5. Export the relationship view diagram.
- 6. Filter assets.
- 7. Search for assets.
- 8. View asset relationships.
- 9. Asset details on hover.
- 10. Relationship direction and name of primary and derived relationship on hover.
The direction of data in the relationship diagram is from left to right. The Analyst tool highlights the asset that you opened in Yellow. You can hover over the relationship name to see if the relationship type is uni-directional or bi-directional. You can view the name of the primary relationship on the line. On the left of the asset you opened is the derived relationship and the on the right is the primary relationship.
The color of the line depends on the type of relationship between the assets. The name of the relationship is displayed on top of the line. The asset that you opened and the related assets form the first level of the relationship diagram. The next level of the diagram is based on the asset in the previous level.
The Analyst tool displays two levels of relationships by default. If there are more relationship levels, you can change the number of levels in the relationship diagram and see additional relationships. If there are more relationships than the Analyst tool can display in the current level, you can see a plus icon next to the asset name. This indicates that the next level of relationships are closed. You can open the closed relationships by changing the display level. For example, the asset Base Metal has additional relationships to the left side that are collapsed in the diagram.
The Analyst tool displays the relationship of an asset when it occurs for the first time in the diagram. The Analyst tool does not display the related assets the next time onwards. However, you can see the number of occurrences of the asset next to the asset name. You can view a summary of the asset when you hover the mouse over above the asset name.
Relationship View Tasks
You can change the way the Analyst tool displays the relationship view diagram. For example, you can search for assets, change the number of levels, and zoom in or zoom out of the diagram. You can export the diagram to a .pdf file or .png file.
Change Relationship View Levels
By default, the Analyst tool shows two levels of the relationship view. You can change the view level to show more or less number of assets in the diagram. To see all the available levels, select All from the Relationship Levels list. You can view up to 75 levels when you select All. The Analyst tool expands the view horizontally to display more levels. You might have to scroll to see the new levels after you increase the number of levels.
Display Full Names
The Analyst tool truncates the names of assets and relationships in the relationship view by default. Select the Display Full Names option to view the complete asset names and relationship names in the relationship view.
Change the Magnification of the Relationship View Diagram
The relationship view diagram might contain many number of assets when you increase the number of view levels or if there are many relationships. The Analyst tool expands the relationship view diagram horizontally to accommodate all the relationships or levels. When the Analyst tool expands the relationship view diagram horizontally, you might have to scroll to see the assets.
Use the Zoom In and Zoom Out icons to change the magnification of the diagram. To avoid scrolling, you can zoom out of the diagram. You can zoom in to a specific area of the relationship view diagram to magnify the assets and relationships in that area. You can also click the Restore Zoom icon to rearrange the diagram to the original size.
Filter Assets
You can use filters to show only the type of assets or relationships that you want to see. You can create custom filters based on the level, asset or relationship type. Create a custom filter to save and reuse the levels, assets or relationship types that you configure.
You can filter the assets that the Analyst tool displays in the relationship view diagram by the relationship type or asset type. You can select the check box next to the name of relationships to apply the filter. You can provide a name and save the filter configuration to see the same levels, type of assets or relationships again. All glossary users can use the custom filters across glossaries. If you do not intend to use filters, you can hide the filter panel. You can delete custom filters.
Export Relationship View Diagram
You can export the relationship view diagram after you open it. Export the relationship view diagram to access the diagram when you are not logged in to the Analyst tool or to share the diagram with users who cannot access Business Glossary.
You can export the relationship view diagram to the following file types:
- •Adobe PDF
- •Portable Network Graphics (PNG) file
The Analyst tool exports the diagram from the Glossary workspace. You can change the view levels or filter the assets to customize the relationship view before you export the diagram. Select Export to PDF or Export to PNG from the Actions menu next to the Hide Filter button to export the relationship view diagram.
Hide or Show Assets
When an asset has multiple relationships which are not displayed because the relationship level does not permit to do so, the Analyst tool displays an icon to hide or show the related assets.
Highlight Assets
You can highlight assets in the relationship diagram based on their occurrence or based on their relationship type.
You can left-click an asset to highlight the occurrences of an asset. You can view the occurrence of the asset in the next level, previous level, and all levels.
You can highlight all the assets that belong to a particular relationship type. You can select a relationship type in the Filter panel to highlight all assets of that relationship type. The Analyst tool highlights the asset name and the lines that connect the related assets.
Search for Assets
You can search for assets in the relationship diagram.
Click Find and type the asset name to search. The Analyst tool looks for the asset among the ones currently displayed. Assets which are hidden because they are part of a different level are not searched.
After you type the search keyword, the Analyst tool displays a list of possible matches. When you select a match, the Analyst tool highlights the asset in the relationship diagram.
Additional Relationship View Tasks
You can interact with assets in the relationship diagram to easily identify information.
You can perform the following tasks in the relationship view diagram:
- Open Asset.
- You can right-click an asset in the relationship diagram and click Open Asset to open the asset in the Glossary workspace. To change the context of the relationship view diagram, you can left-click the asset.
- View Asset Details
- You can hover the mouse over the name of the asset that you have selected to view the asset details. The Analyst tool displays the asset description, state of the asset, and number of occurrences of the asset. Click the asset name to rearrange the relationship diagram based on that asset.
Relationship View Example
The relationship view example describes how the Analyst tool displays the relationship data when you open an asset, and how the context of the relationship view changes based on your interaction with the asset. You open the business term in the Glossary workspace and click the Relationships View tab.
For the relationship view example, consider a business term, "Founder's Share" in the Financial glossary.
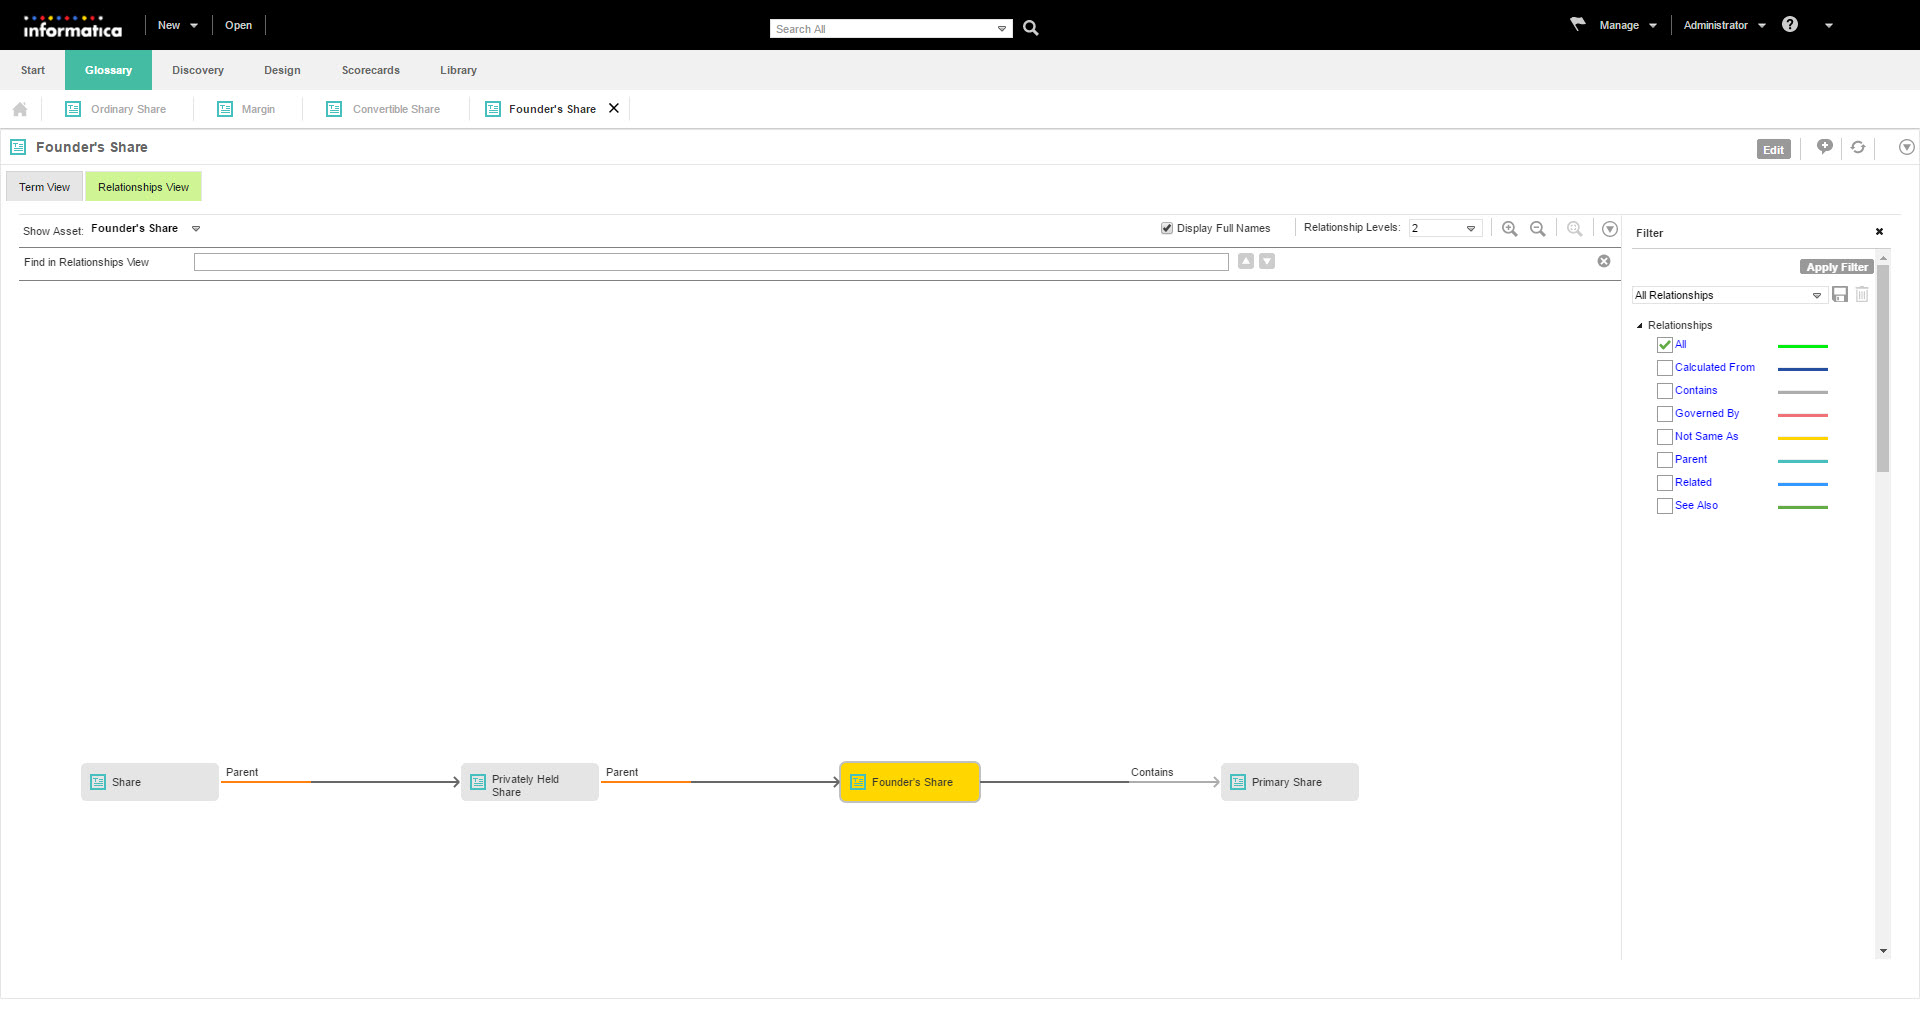
The following image shows the relationship view diagram of the terms related to "Founder's Share:"

- Level One
- The first level displays the assets that are related to the term, "Founder's Share." The term "Founder's Share" contains the term "Primary Share" which is displayed on the right. The term "Privately Held Share" is the parent of "Founder's Share" which is displayed on the left. The name of the primary relationships are on the line connecting the terms.
- Level Two
- The term "Privately Held Share" has a parent, "Share." Hence, it is displayed to the left of the term "Privately Held Share."
- Together, they form the parent-child relationship.
The term "Share" contains related assets, but they are not displayed because the context of the relationship view diagram is "Founder's Share." When you click the term "Share" in the relationship view, the Analyst tool rearranges the context of the relationship view diagram with the term "Share" highlighted. The term "Share" is highlighted in Yellow.
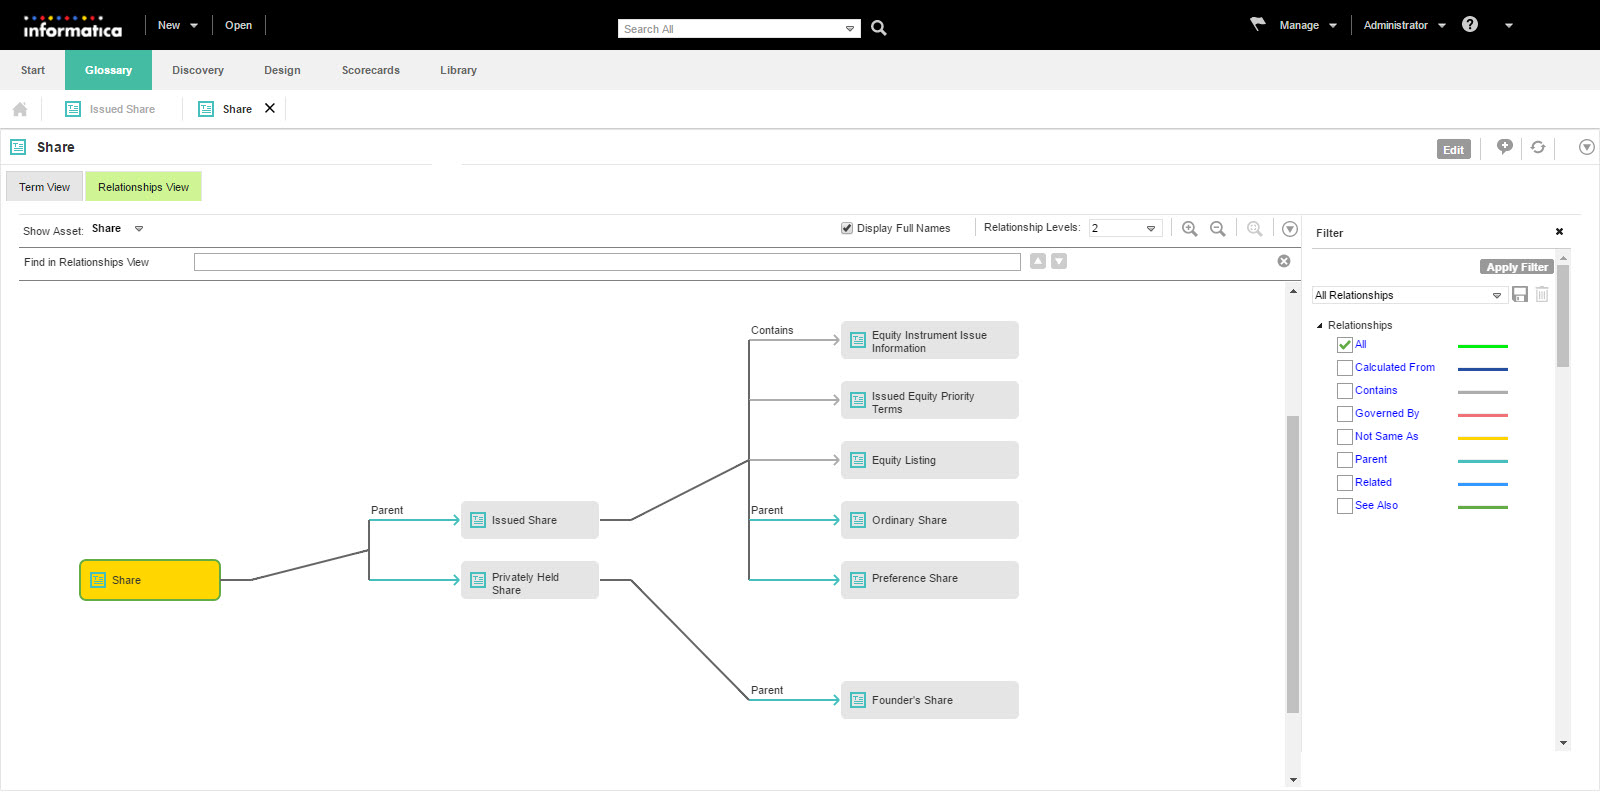
The following image shows the relationship view diagram of the term "Share:"

- Level One
- The context of the first level is the term "Share." "Privately Held Share" and "Issued Share" are the children of "Share."
- Level Two
- "Issued Share" contains three types of relationships that you can see in the second level. "Preference Share" and "Ordinary Share" are the children. "Issued Share" contains "Equity Instrument Issue Information," "Issued Equity Priority Terms," and "Equity Listing."
- "Privately Held Share" has one type of relationship that you can see in the second level. "Founder's Share" is a parent to "Privately Held Share."


