Compare Multiple Profile Results Overview
You can compare profile results for two profile runs. You can view the compare results in summary view, and column results in detailed view.
In the summary view, you can view the compare results for all the columns in both the profile runs.
Comparing Multiple Profile Results
When you compare two profile runs, you can view the profile results comparison in summary view.
1. In the summary view, click Actions > Compare Profile Run.
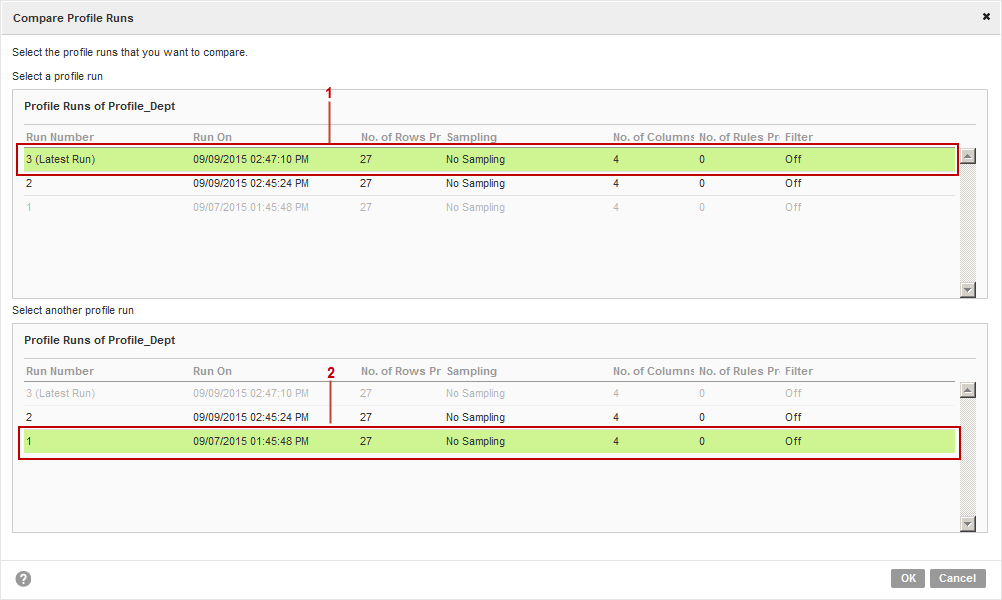
The following image shows the Compare Profile Runs dialog box.
- a. Run A. Choose a profile run as Run A.
- b. Run B. Choose a profile run as Run B.
The Compare Profile Runs dialog box appears.
2. Select a profile from the Run A pane, and select another profile from the Run B pane.
3. Click OK.
The summary view displays a consolidated view of the profile results.
Summary View of Compare Profile Results
When you compare two profile runs, you can view the results in a grid format in the summary view. You can use the default filters in the summary view to view specific statistics.
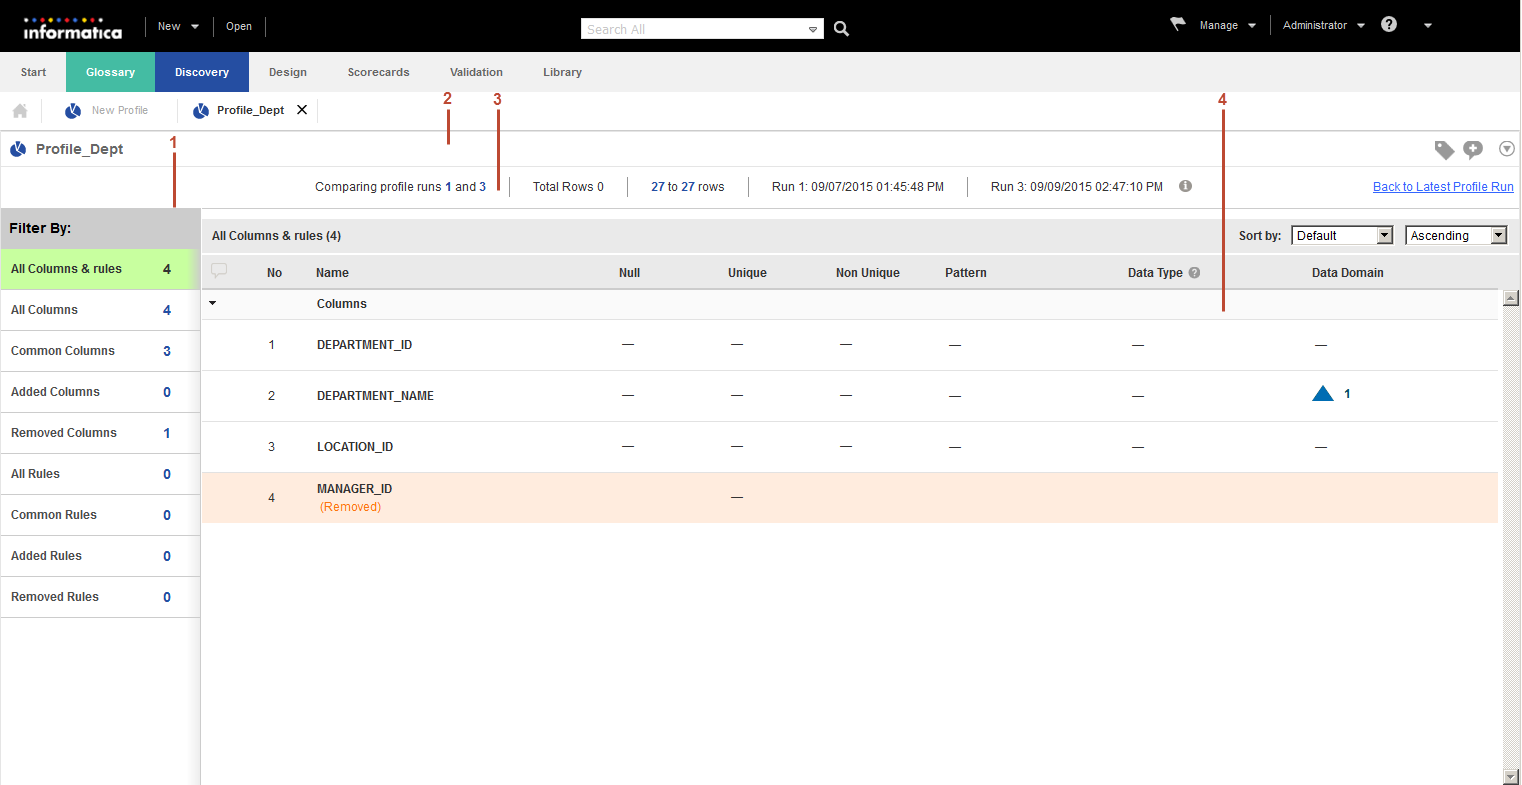
The following image shows the compare profile results for two profile runs in summary view:
- 1. Default filter. You can view the profile comparison results in the summary view based on the default filters.
- 2. Profile header. You can view the profile name in the header.
- 3. Summary view header. You can view profile specific information in the summary view header. You can view the profile runs that is compared, increase or decrease in rows between the profile runs, number of rows in the profile, and the time and date of the profile runs.
- 4. Summary view. You can view the comparison between the columns in both the profile runs.
Summary View Properties for Profile Results Comparison
The summary view properties for compare profile results includes the number and percentage of distinct, non-distinct, and null values, patterns, inferred data types, inferred data domains, and linked business terms. The summary view includes a visual representation of the properties. You can click each summary property to sort on values of the property.
In the summary view, the Data Integration Service assigns a number in ascending order to all the columns and rules
Note: An up arrow with a numeric count displays an increase in values of a property from one profile run to another. A down arrow with a numeric count displays a decrease in values of a property from one profile run to another.
The following table describes the summary properties for compare profile results:
Property | Description |
|---|
No | Displays the number of the column or rule. |
Name | Displays the name of the column or rule in the profile. |
Null | Displays the increase or decrease in null values. |
Distinct | Displays the increase or decrease in distinct values. |
Non-distinct | Displays the increase or decrease in non-distinct values. |
Pattern | Displays the variation in patterns between the profile runs. |
Data type | Displays the variation between the inferred data types for the column or rule in the two profile runs. |
Data Domain | Displays the variation between the inferred data domains associated with the column or rule in the two profile runs. |
Default Filters for Profile Results Comparison in Summary View
You can view the profile results based on the default filters in the summary view.
In the summary view, you can view source columns and virtual columns. The output for a rule appears as a virtual column in the summary view. When you change the output port for a rule and compare the profile run with a historical run, the historical rule output column appears in the Removed Rules filter and the new rule output column appears in the Added Rules filter. If you change the rule logic for a single output rule, or if you change the inputs for a multiple rule output in a profile run and compare it with a historical run, the Added Rules and Removed Rules filter output does not change. The filter output does not change because the filters consider only name changes to the columns as valid inputs to the filter.
You can use the following default filter options to view the profile results that meet specific conditions:
Default Filter Option | Description |
|---|
All Columns & rules | Displays the profile results for the source columns, virtual columns, and rule columns. You can expand and collapse the source columns and rule columns to view the results. |
All Columns | Displays the profile results for the source columns and virtual columns. |
Common Columns | Displays the columns available in both the profile run results. |
Added Columns | Displays the columns available in the latest profile run. For example, when you compare run 5 with run 3, the Added Columns displays the columns available in run 5 and not run 3. |
Removed Columns | Displays the columns available in the historical profile run. For example, when you compare run 5 with run 3, the Removed Columns displays the columns available in run 3 and not run 5. |
All Rules | Displays the profile results for all the rule columns. |
Added Rules | Displays the rules available in the latest profile run. For example, when you compare run 5 with run 3, the Added Rules displays the rules available in run 5 and not run 3. |
Removed Rules | Displays the rules available in the historical profile run. For example, when you compare run 5 with run 3, the Removed Rules displays the rules available in run 3 and not run 5. |
The summary view displays the profile results for all source columns and virtual columns by default.
Detailed View of Compare Profiles Results
Column results appear in a grid format in the detailed view. Column details include general information such as distinct, non-distinct, and null values, patterns, data types, data domains, business terms, values, and data preview.
The detailed view for a column appears when you click the column name. You can view the column results in run A and run B as separate columns, and the comparison of data is available in the delta column.
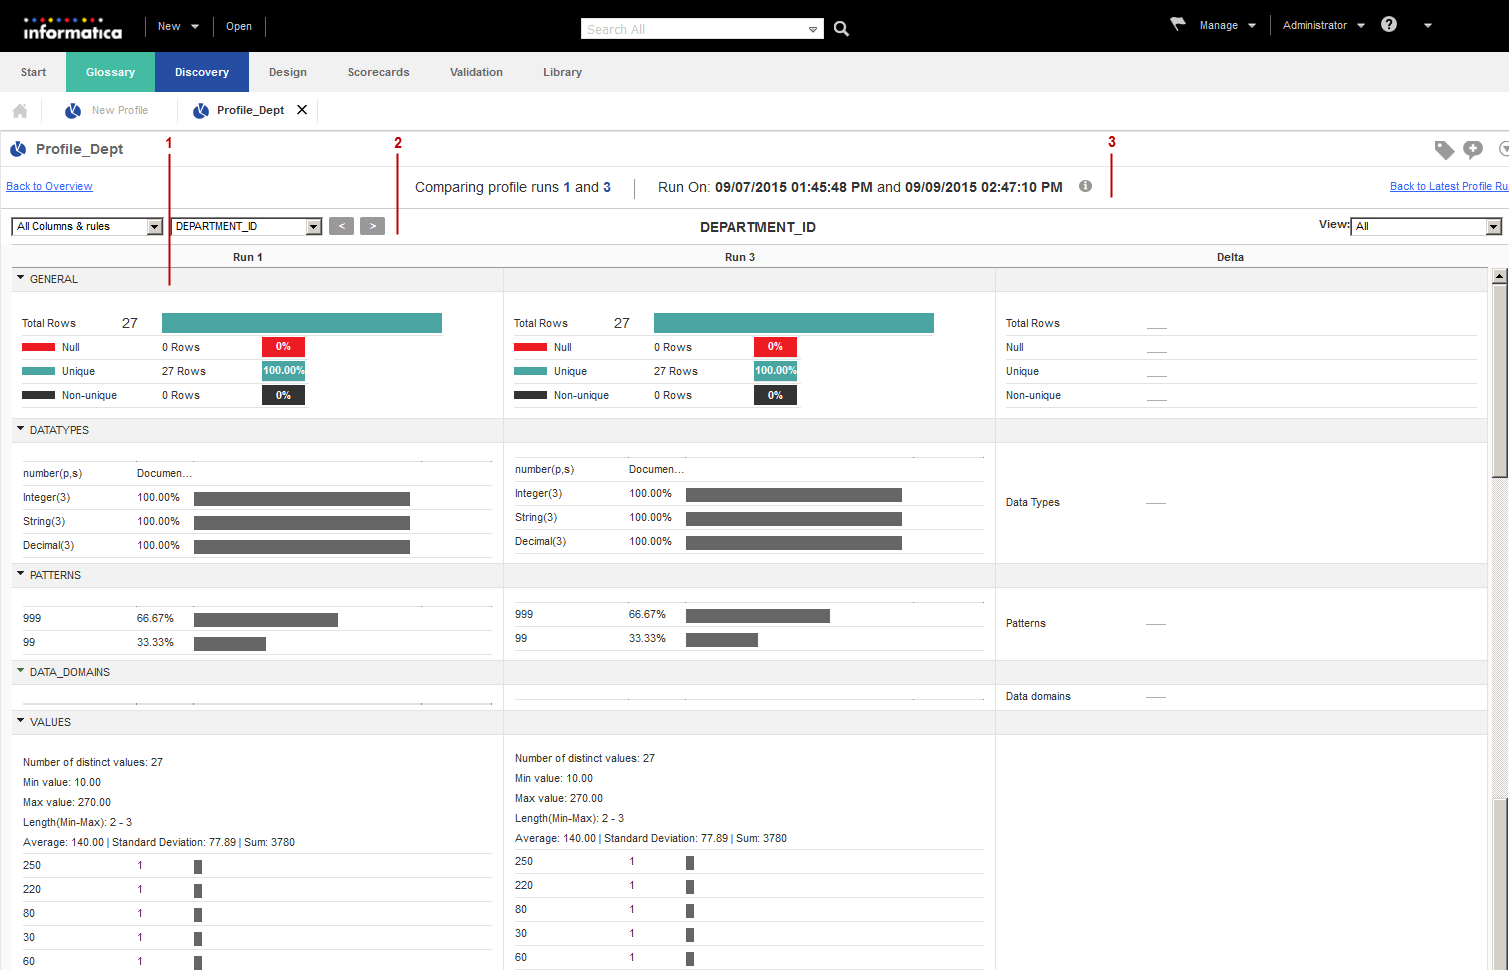
The following image shows the compare profile results for a column in detailed view:
- 1. Panes. You can view the profile results and statistics for the column in the two profile runs, and view the delta information for the column in the two profile runs in panes.
- 2. Profile header. You can view column results by selecting the column in the drop-down list or by using the navigation buttons. You can view the column name, and can view specific results by using the options in the View drop-down list.
- 3. Summary view header. You can view profile specific information in the summary view header. You can view the profile runs that is compared and the time and date of the profile runs.
Detailed View Panes for Profile Results Comparison
The detailed view displays the profile results and comparison results for a column in the two profile runs in detail.
The detailed view displays the column results for run A and run B, and the comparison of data is available in the delta column. To view other column results, you can select a filter from the filter drop-down list or select the column from the column drop-down list.


