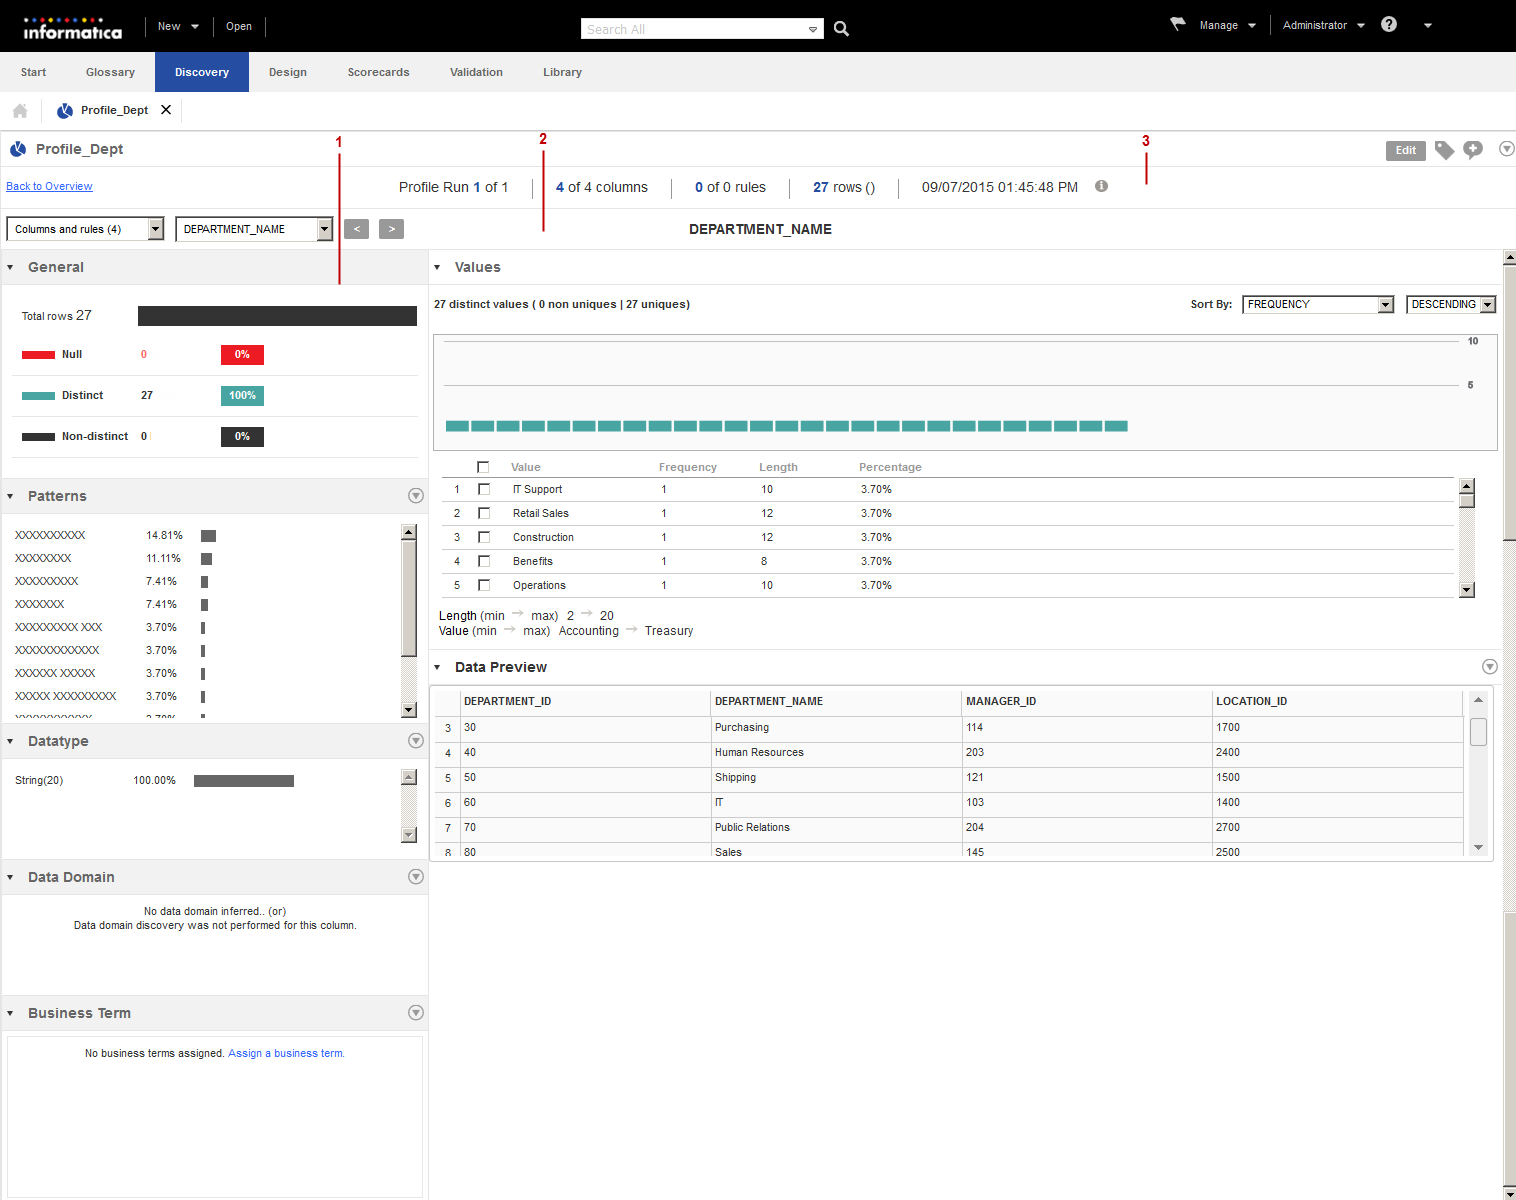

Panes | Description |
|---|---|
General | Displays the number of rows with null values, distinct values, and non-distinct values in different colors. You can view the values in percentages. You can view the increase and decrease of the general values in every consecutive profile run as a sparkline. A sparkline displays the variation in the number of null values, distinct values, or non-distinct values across the latest five consecutive profile runs in a line chart. You can view the number of values and the percentage of values when you move the pointer over the sparkline for each profile run. You can add tags and comments to the column. |
Patterns | Displays the patterns for the column values. The frequency in which the patterns appear in a column appears as a horizontal bar chart and in percentages. You can drill down on a pattern, add a pattern to a reference table, or create a data domain with the selected pattern. |
Data type | Displays the inferred data types for the column. The frequency of the data types in a column appears as a horizontal bar chart and in percentages. You can drill down on a data type, approve, reject, or reset the selected inferred data type. The Show Rejected option displays rejected inferred data types. |
Data Domain | Displays the inferred data domains for the column. You can drill down on a data domain for conforming rows, non-conforming rows, or rows with null values. You can approve, reject, or reset the data domain value. The Show Rejected option displays rejected data domains. You can verify the data domain value. |
Business Term | Displays the assigned business term for the column. You can assign or unassign a business term to a column. |
Values | Displays all the values in the column in a graphical representation along with the frequency, length, and percentage. You can drill down on each value. You can add the value to a reference table, create a value frequency rule, and create a data domain. |
Data Preview | Displays the drilldown data for the selected pattern, data type, data domain, or value. |