Statistics
You can view statistics, such as values, patterns, data types, data domain, and outliers for the columns and rules in a profile.
You can view profile statistics in summary view, and view column statistics in summary view and detailed view. You can view statistics for the latest profile run, historical profile run, and consolidated profile run. You can compare profile results for two profile runs, and view the statistics for the profile and columns in summary view and detailed view.
Data Preview
You can view the drill-down data for the selected pattern, data type, data domain, or value in the Data Preview pane.
You can view the Data Preview pane in the detailed view. When you click a column in summary view, the detailed view appears and the Data Preview pane is collapsed by default. To view the column data, you can click Actions > Show Preview.
The following table describes the options in the Actions menu in the Data Preview pane:
Option | Description |
|---|
Add to Filter | Create a drill-down filter to filter the drill-down data so that you can analyze data irregularities on the subsets of profile results. |
Save Filter | Saves the drill-down filter. |
Show Preview | Displays the source rows. |
Export Data | Exports the drilldown results to a CSV file or Microsoft Excel file. |
Data Types
The data types include all the inferred data types for each column in the profile results.
You can view the data types in summary view and detailed view. In the summary view, you can view the documented data type and the inferred data types. The Conflicting data type filter displays the columns where a conflict between the documented data type and inferred data type exists. In the detailed view, you can view the inferred data types for the column. The frequency of the data types in a column appears as a horizontal bar chart and in percentages. You can drill-down, approve, reject, or reset the selected inferred data type. The Show Rejected option displays rejected inferred data types.
The following table describes the properties for the data types:
Property | Description |
|---|
Data type | Displays the list of documented and inferred data types for the column in the profile. |
Frequency | Displays the number of times a data type appears for a column, expressed as a number. |
Percent | Displays the percentage that a data type appears for a column. |
Drill down | Drills down to specific source rows based on a column data type. Note: You cannot perform a drill-down action if you select multiple inferred data types. |
Status | Indicates the status of the data type. The statuses are Inferred, Approved, or Rejected. - Inferred
- Indicates the data type of the column that the Analyst tool inferred.
- Approved
- Indicates an approved data type for the column. When you approve a data type, you commit the data type to the Model repository.
- Rejected
- Indicates a rejected data type for the column.
|
Outliers
An outlier is a pattern, value, or frequency for a column in the profile results that does not fall within an expected range of values.
The profiling plug-in the Data Integration Service runs an algorithm to identify the values that do not fall within the range of the majority of values in the column. Any pattern, value, or frequency that does not fall within the expected range of these majority values in the column is an outlier.
By default, the Analyst tool does not determine outliers in the profile results. In the summary view, you can run the outlier to view the outlier results. The Pattern outlier filter displays the outliers based on the patterns in the column. The Value Frequency outlier filter displays the outliers based on the values or frequencies in the column. The outlier detection occurs in the background so that you can perform other actions in the summary view.
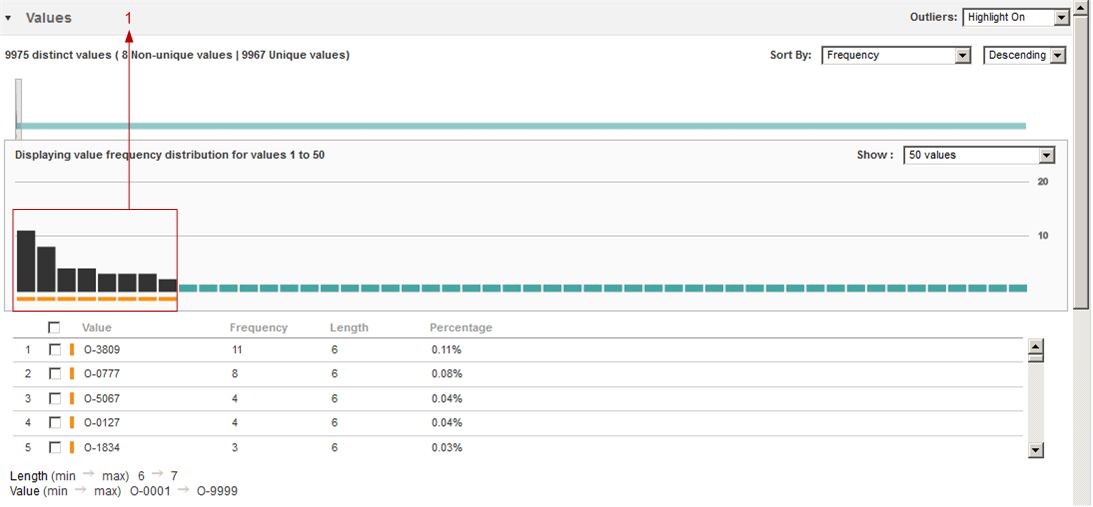
In the detailed view, you can view the outlier values in the Values pane when you select the Highlight On option from the list. The outlier value appears as a vertical bar with an orange underline. To view only the outlier value, you must select the Filter option from the list.
- 1. Outlier values. An outlier value appears as a vertical bar with an orange underline.
Running an Outlier
Run an outlier to identify patterns, values, or frequencies in a column that do not fall within an expected range of values.
1. In the summary view, click Actions > Detect Outlier.
The Pattern outlier and Value Frequency outlier in the Filter By pane changes from N/A to the number of outliers detected.
2. In the Filter By pane, click Pattern outlier.
The columns with pattern outliers appear in the summary view.
3. In the Filter By pane, click Value Frequency Outlier.
The columns with value or frequency outliers appear in the summary view.
4. In the detailed view, select Highlight On from the outlier drop-down list.
In the Values pane, the outliers appear as vertical bars with orange underlines.
5. Click Filter in the Outliers dropdown list to view only outlier values.
Patterns
You can view the patterns for the column values and the frequency in which the patterns appear in summary view and detailed view.
In the summary view, you can view the multiple patterns in the column as horizontal bar charts. You can view the pattern characters and the number of similar patterns in a column as a percentage when you hover the mouse over the bar chart. In the detailed view, you can view the frequency with which the patterns appear in a column as a horizontal bar chart and in percentages. You can drilldown, add the pattern to a reference table, or create a data domain with the selected pattern.
The profiling warehouse stores a maximum of 16,000 unique highest frequency values including NULL values for profile results by default. If there is at least one NULL value in the profile results, the Analyst tool can display NULL values as patterns.
Note: The Analyst tool cannot derive the pattern for a numeric column that has a precision greater than 38. The Analyst tool cannot derive the pattern for a string column that has a precision greater than 255.
The following table describes the properties for the column patterns:
Property | Description |
|---|
Pattern | Displays the pattern for the column in the profile. |
Frequency | Displays the number of times a pattern appears for a column, expressed as a number. |
Percentage | Displays the percentage that a pattern appears for a column. |
The following table describes the pattern characters and what they represent:
Character | Description |
|---|
'B' or 'b' or ' ' | Represents a blank space. |
'C' or 'c' | Represents any character. |
'L' or 'l' | Represents any lowercase alphabetic character. |
‘T’ or ‘t’ | Represents a tab. |
‘U’ or ‘u’ | Represents any uppercase alphabetic character. |
9 | Represents any numeric character. Informatica Analyst displays up to three characters separately in the "9" format. The tool displays more than three characters as a value within parentheses. For example, the format "9(8)" represents a numeric value with eight digits. |
'X' or 'x' | Represents any alphabetic character. Informatica Analyst displays up to three characters separately in the "X" format. The tool displays more than three characters as a value within parentheses. For example, the format "X(6)" might represent the value "Boston." Note: The pattern character X is not case sensitive and might represent uppercase characters or lowercase characters from the source data. |
'P' or 'p' | Represents "(", the opening parenthesis. |
'Q' or 'q' | Represents ")", the closing parenthesis. |
Note: Column patterns can also include special characters. For example, ~, [, ], =, -, ?, =, {, *, -, >, <, and $.
Values
You can view values for columns and the frequency in which the values appear in the column.
View minimum and maximum values in a column in the summary view. In the detailed view, you can view the value properties for a column.
Values in Summary View
You can view the minimum and maximum values for all the columns and rules for the latest profile run, historical profile run, and consolidated profile run in the summary view.
Example 2. Example
A retail store database has a column named Employee ID in the Employee table populated with employee IDs ranging from 100 through 250 and has names, such as Bob and Robert as well. When you run a column profile on the Employee table, the Value column for Employee ID in summary view displays 100 --> Robert
Values in Detailed View
The column values in detailed view include values for a column and the frequency in which the values appear in the column.
The Values pane displays the column values in a graphical representation. You can view the frequency, length, and percentage of each value. You can sort the values based on value or frequency. You can drill down on the data, add the values to a reference table, create a value frequency rule, or create a data domain. You can view the null values as a red vertical bar, the frequency of values as a black vertical bar, and the outlier values as vertical bars with orange highlight. You can highlight the outliers, disable outliers, or filter the results to display only outlier values in the column.
The Values pane contains the graphical layout and value sections.
The graphical layout is divided into two panels.
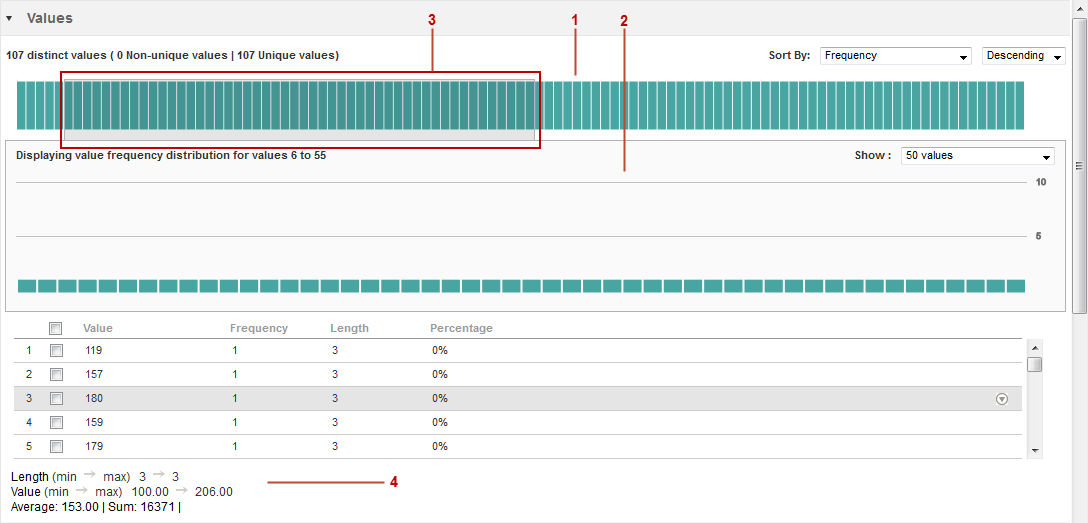
The following image shows the Values pane in the detailed view:
- 1. Upper panel. You can view the values as a vertical bar chart. You can sort the values by frequency and value. You can sort the value in ascending or descending order. You can view the outlier values as vertical bars with orange highlights.
- 2. Lower panel. You can view the values in the slider in the lower panel where each value is represented by a vertical bar. You can drill down on the value, add the value to a reference table, create a value frequency rule, and create a data domain on the value. You can view 50, 75, or 100 values at a time.
- 3. Slider. You can slide the slider over the values in the upper panel. The lower panel displays the values in the slider.
- 4. Value properties. The value properties section displays the values and properties.
The following table describes the panels in the graphical layout:
Panel | Description |
|---|
Upper panel | Displays all the values as a vertical bar chart. You can view a maximum of 16,000 values in the upper panel. You can use the slider to view a batch of values. |
Lower panel | Displays the values for the batch that you select in the upper panel. By default, the Analyst tool displays 50 values. You can choose to view 75 or 100 values at a time. |
The following table describes the properties for the column values in the value section:
Property | Description |
|---|
Value | Displays a list of values for the batch that you select in the upper panel. Note: The Analyst tool excludes the CLOB, BLOB, Raw, and Binary data types in column values. |
Frequency | Displays the number of times a value appears in the column, expressed as a number. |
Length | Displays the length of the column value. |
Percentage | Displays the percentage that a value appears in the column. |
The following table describes the statistics for the selected column:
Statistics | Description |
|---|
Length (min - max) | Displays the length of the shortest value and longest value for the column. |
Value (min - max) | Displays the minimum and maximum values in the column. |
Average | Displays the average of the values for the column. |
Sum | Displays the sum of all the values in the column. |
Values in Detailed View for Profile Results Comparison
The Values pane in detailed view for profile results comparison displays value properties, such as number of distinct values, minimum value, maximum value, maximum and minimum length, average, standard deviation, and sum of values.
The detailed view of a column for profile results comparison displays value properties, value, and the frequency of the value with a horizontal bar chart.
The following table describes the properties for the column values in the detailed view when you compare the results of two profile runs.:
Property | Description |
|---|
No. of distinct values | Displays the number of distinct values in the column. |
Min value | Displays the minimum value in the column. |
Max value | Displays the maximum value in the column. |
Length (Min - Max) | Displays the length of the shortest value and longest value for the column. |
Average | Displays the average of the values for the column. |
Standard Deviation | Displays the standard deviation or variability between column values for all values of the column. |
Sum | Displays the sum of all the values in the column. |


