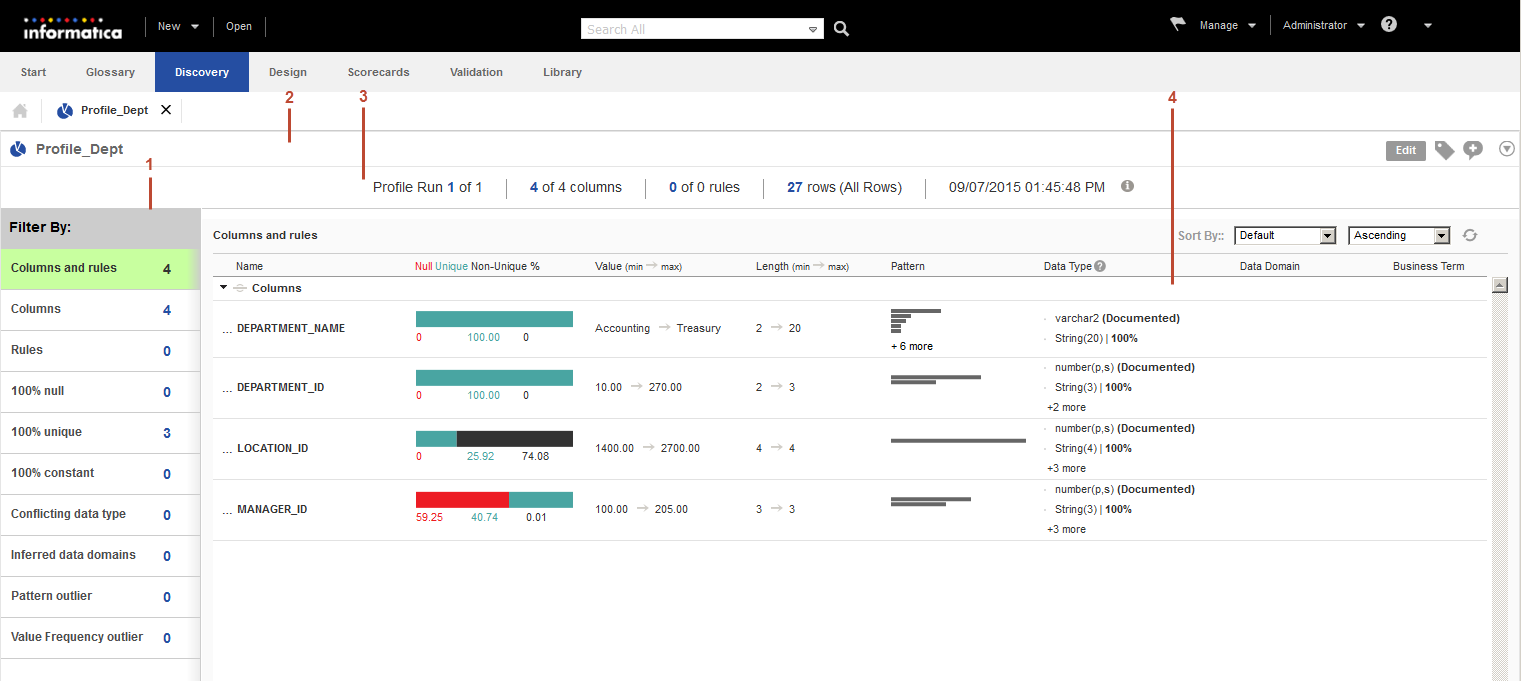
The following image shows a sample graphical view of summary view: 


Property | Description |
|---|---|
Name | Displays the name of the column or rule in the profile. |
Null Distinct Non-Distinct % | Displays the null values, distinct values, and non-distinct values in percentages for a column or rule output. You can view the values in a horizontal bar chart. |
Pattern | Displays the multiple patterns in the column as horizontal bar charts. You can view the pattern characters and the number of similar patterns in a column as a percentage when you hover the mouse over the bar chart. |
Value | Displays the minimum and maximum values in the column or rule output. |
Length | Displays the minimum and maximum length of the values in the column or rule output. |
Data Type | Displays the documented data type of the column or rule. Displays the inferred data types when you hover the mouse over the field. The Analyst tool can infer the following data types:
You can also view the percentage of conformance based on the inferred data types. Note: The Analyst tool cannot derive the data type from the values of a numeric column that has a precision greater than 38. The Analyst tool cannot derive the data type from the values of a string column that has a precision greater than 255. If you have a date column on which you create a column profile with a year value earlier than 1800, the inferred data type might show up as fixed length string. Change the default value for the year-minimum parameter in the InferDateTimeConfig.xml, as required. |
Data Domain | Displays the names of the data domains associated with the column along with the percentage of conformance and the number of conforming rows. |
Business Term | Displays the business term assigned to the column. |
Default Filter Option | Description |
|---|---|
Columns and rules | Displays the profile results for the source columns, and rule columns. You can expand and collapse the source columns and rule columns to view the results. |
Columns | Displays the profile results for the source columns. |
Rules | Displays the profile results for the rule columns. |
100% null | Displays the profile results for the columns that have 100% null values. |
100% distinct | Displays the profile results for the columns that have 100% distinct values. |
100% constant | Displays the profile results for the column that have the same value for all records. For example, 100% constant filter includes the profile results of a Country column if it contains only a "USA" value. |
Conflicting data types | Displays the profile results for columns where the documented data type and inferred data type do not match. For example, the filter displays the column CustomerTier because the documented data type for the column is Integer (2) and the inferred data type is string. |
Inferred data domains | Displays the profile results for the columns where the inferred data domain is the same as the configured data domain. |
Pattern outlier | Displays the profile results for the columns that have pattern outliers. |
Value frequency outlier | Displays the profile results for the columns that have value or frequency outliers. |