Informatica Administrator
This section describes new Administrator tool features in version 10.0.
Manage Tab
Effective in version 10.0, the Manage tab has the following new features:
- Domain view
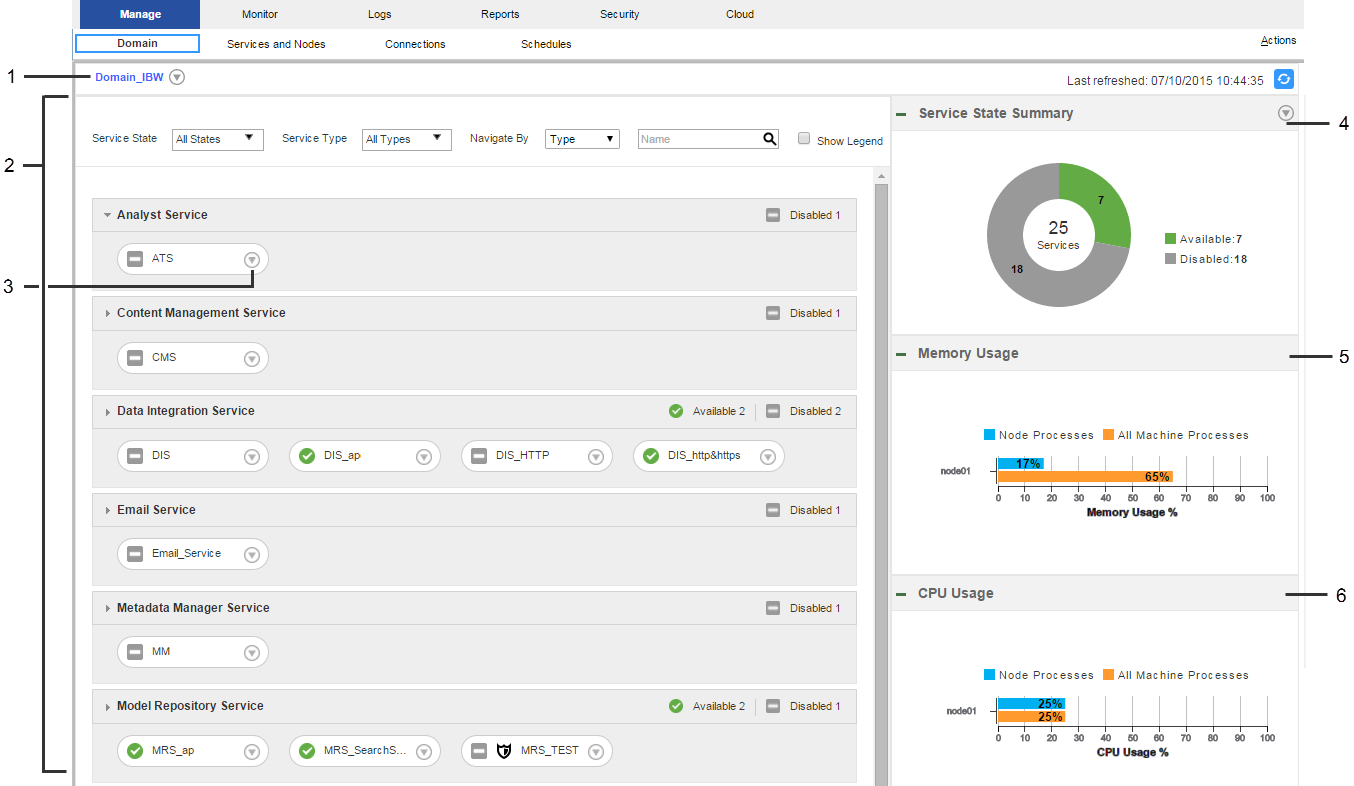
The Domain view is an overview of the status of the domain. You can view information about the domain, view historical information about the domain, and perform common actions.
The following image shows the Domain view on the Manage tab:
The Domain view contains the following information:
- - Domain. You can view properties, logs, and past events for the domain. You can also shut down the domain.
- - Contents panel. Displays services, nodes, and grids in the domain. You can view properties, events, logs, and dependencies for objects. You can also enable, disable, and recycle services and shut down nodes.
- - Filter. You can filter domain contents by state or service type. You can also search domain objects, or navigate domain objects by type, grid, or folder.
- - Service State Summary. Doughnut chart that displays the number and states of services in the domain.
- - Resource usage panels. Bar charts that compare memory and CPU usage for objects in the domain to memory and CPU usage for all processes on the machine.
- - Command History. Displays the 50 most recent enable, disable, and recycle commands that users issued from the Administrator tool.
- - History view. Displays historical status, resource consumption, and events in the domain for a selected time range.
- - Events panel. Displays events for services and nodes in the domain.
- Navigator
- You can search for and filter nodes, application services, and grids in the Domain Navigator on the Services and Nodes view. You can search for an object by name. Or, you can filter the list of objects that appear in the Navigator by object type.
- Schedules view
- You can view and manage schedules on the Schedules view.
For more information, see the Informatica 10.0 Administrator Guide.
Dependency Graph
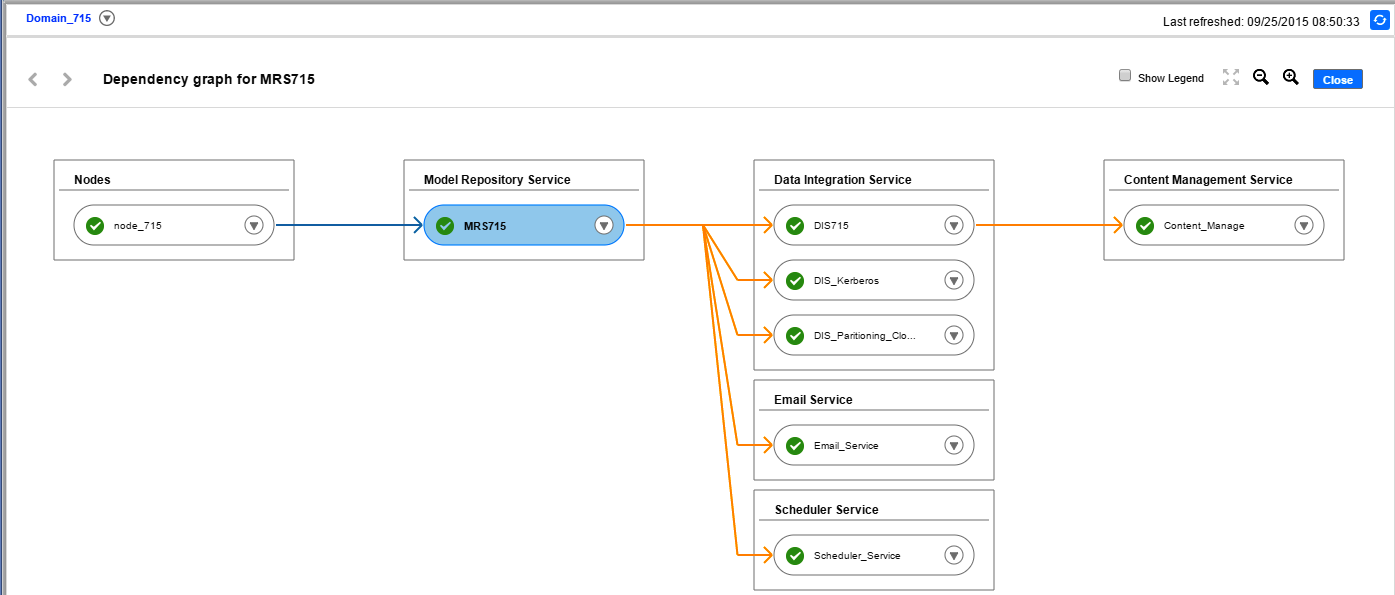
Effective in version 10.0, the Dependency graph is accessed from the Domain view on the Manage tab. Previously, the Dependency graph was accessed from the Services and Nodes view on the Domain tab.
The Dependency graph has a new user interface and additional functionality.
The following image shows the new Dependency graph:
You can perform the following tasks in the Dependency graph:
- •View properties for a service, node, or grid.
- •View logs for a service.
- •Shut down a node.
- •Enable or disable a service.
- •Recycle a service.
- •Disable downstream dependencies for a service. You can disable one or more services that depend on a service. Downstream processes are disabled in abort mode.
- •Recycle downstream dependencies for a service. You can recycle one or more services that depend on a service. Downstream processes are recycled in abort mode.
For more information, see the Informatica 10.0 Administrator Guide.
Monitoring
Effective in version 10.0, the Monitoring tab in the Administrator tool is renamed the Monitor tab.
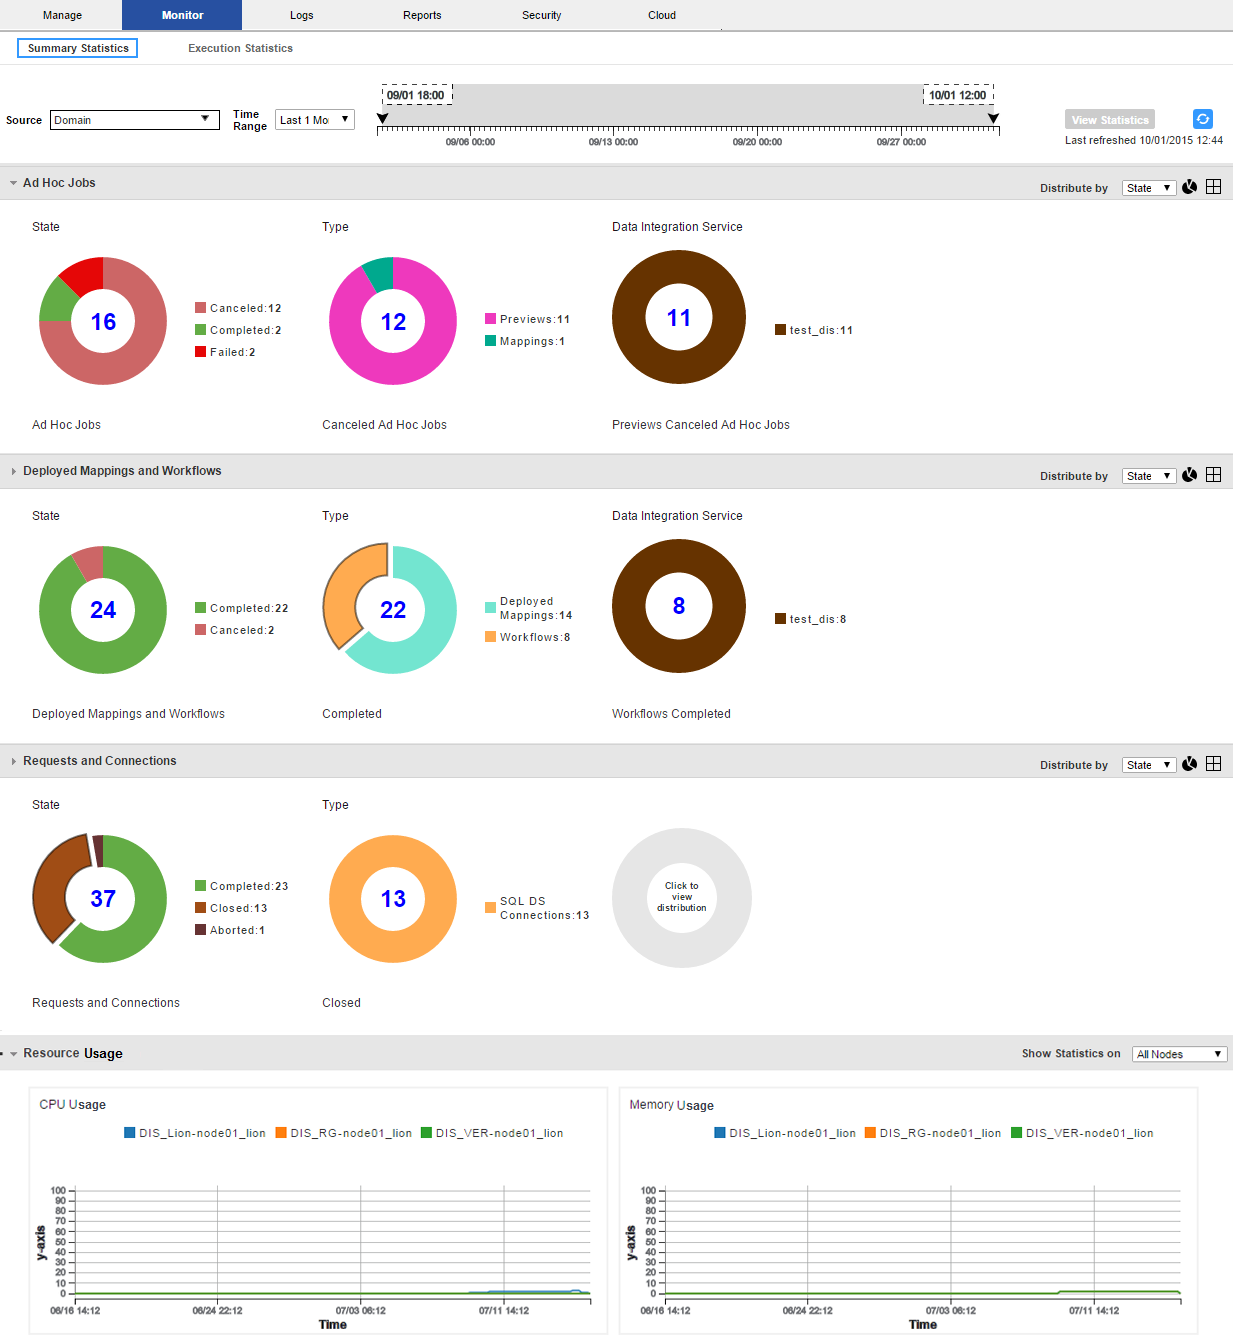
The Monitor tab has the following new features:
- Views on the Monitor tab
- The Monitor tab contains the following views:
- Views on the Execution Statistics view
- You can view statistics about ad hoc mapping jobs, deployed mapping jobs, and mapping objects in a workflow.
- When you select one of these objects in the contents panel, the details panel displays the following new views:
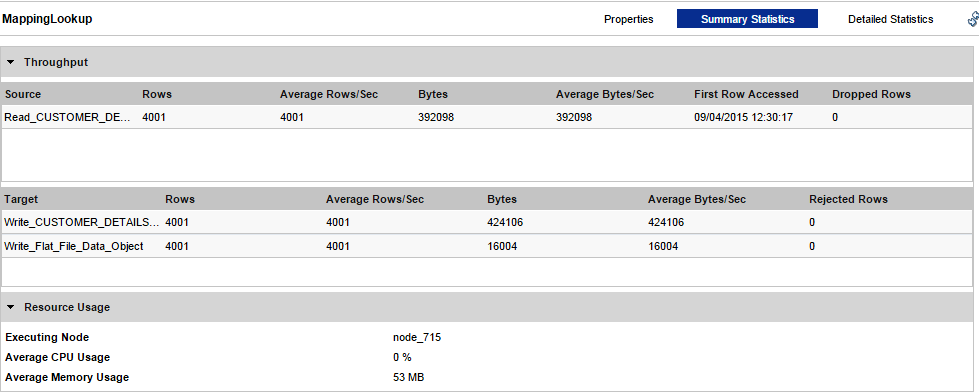
- - Summary Statistics view. Displays throughput and resource usage information for the source and target.
The following image shows the Summary Statistics view for a mapping job:
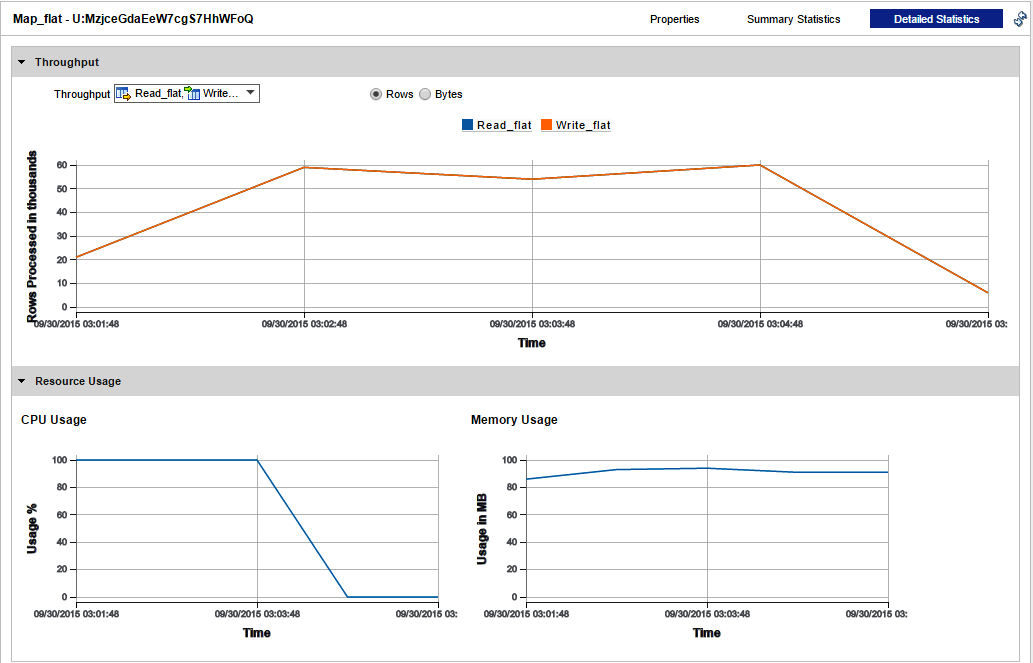
- - Detailed Statistics view. Appears for jobs that run in separate local processes for longer than one minute. Displays graphs of throughput and resource usage information for the source and target.
The following image shows the Detailed Statistics view for a mapping job in a workflow:
- Configuration
- Monitoring Configuration, formerly Global Settings, has the new option Preserve Detailed Historical Data. Use this option to configure when expired per-minute statistics can be purged from the Model repository. Default is 14. Minimum is 1. Maximum is 14.
For more information, see the "Monitoring" chapter in the Informatica 10.0 Administrator Guide.
