Informatica Administrator
This section describes changes to the Administrator tool in version 10.0.
Domain tab
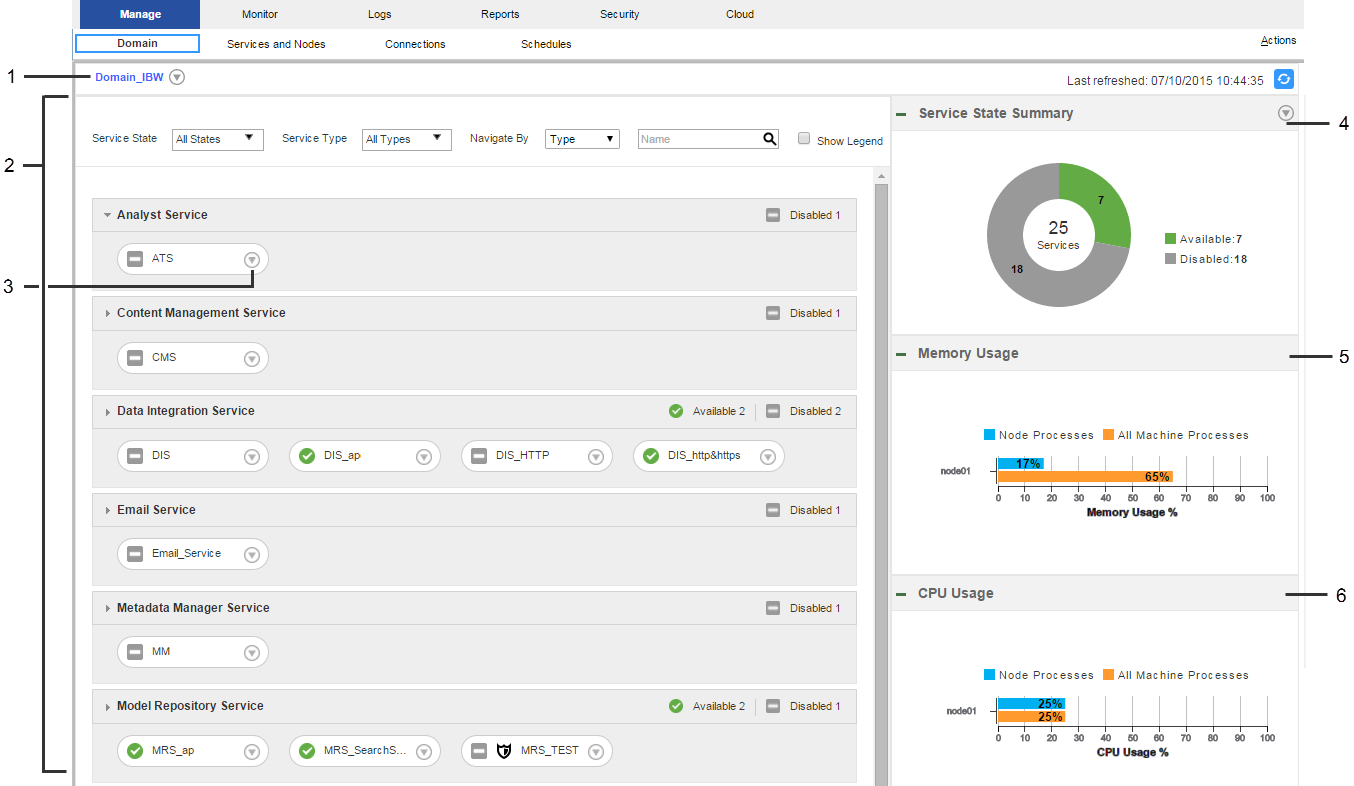
Effective in version 10.0, the Domain tab is renamed the Manage tab.
The Manage tab has the following changes:
- Views on the Manage tab
- The Manage tab includes the Domain and Schedules views. Use the Domain view to view and manage the status and resource consumption of the domain. Use the Schedules view to create and manage reusable schedules for deployed mappings and workflows.
The following image shows the Domain view on the Manage tab:
- Dependency graph
- The dependency graph is moved from the Services and Nodes view to the Domain view. To access the dependency graph, click the Actions menu for the domain, a service, or a node, and then choose View Dependencies
- Global Settings
- Global Settings are moved from the Monitor tab, formerly Monitoring tab, to the Services and Nodes view. The Global Settings are renamed Monitoring Configuration and are a view in the Services and Nodes view.
- Overview views
- The Overview views for the domain and folders in the Services and Nodes view are removed. They are replaced by the Domain view on the Manage tab.
For more information, see the Informatica 10.0 Administrator Guide.
Monitoring
Effective in version 10.0, monitoring in the Administrator tool has the following changes:
Global Settings
Global Settings have the following changes:
- •Global Settings are moved from the Monitor tab Actions menu to the Manage tab. Configure global settings on the Monitoring Configuration view on the Services and Nodes view.
- •The Number of Days to Preserve Historical Data option is renamed Number of Days to Preserve Summary Historical Data. Minimum is 0. Maximum is 366. Default is 180.
- •The Date Time Field option is renamed Show Milliseconds in Date Time Field.
Jobs
Jobs that users deploy from the Developer and Analyst tools are called ad hoc jobs. Ad hoc jobs include previews, mappings, reference tables, enterprise discovery profiles, profiles, and scorecards. Previously, ad hoc jobs were called jobs.
Navigation
The Monitoring tab is renamed the Monitor tab. Object monitoring is moved to the Execution Statistics view.
Preferences
Preferences in the Monitor tab Actions menu is renamed Report and Statistic Settings.
For more information, see the "Monitoring" chapter in the Informatica 10.0 Administrator Guide.

