Monitor a Mass Ingestion Specification in the Mass Ingestion Tool
You can monitor a mass ingestion specification in the Mass Ingestion tool. Monitor the mass ingestion specification details and specification history on the Overview page, and monitor ingestion job statistics on the Execution Statistics page.
The Overview page provides general details on the specification, the deployment history, and the execution history. The Execution Statistics page provides detailed statistics on the ingestion job for a specification run instance.
Overview Page
On the Overview page, review details on a mass ingestion specification, the deployment and run options, and the execution history. The execution history lists the run instances for the mass ingestion specification. Each run instance lists the start time of the ingestion job and the name of the Data Integration Service where the specification runs.
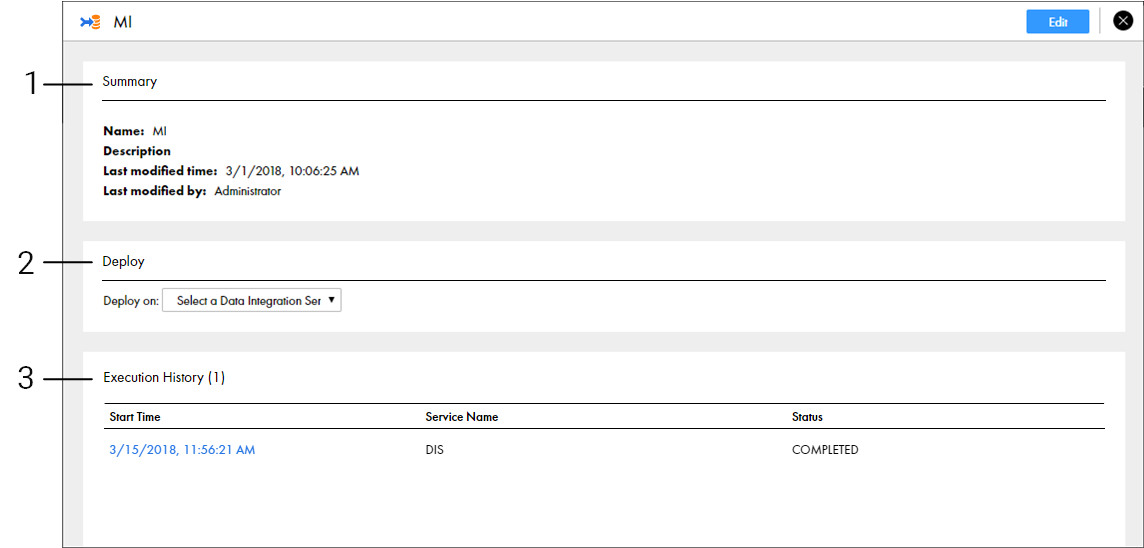
The following image shows the Overview page:
- 1. Summary. Displays general mass ingestion specification properties.
- 2. Deploy. Displays options to deploy the mass ingestion specification.
- 3. Execution History. Displays the run instances of the mass ingestion specification.
Summary View
The Summary view displays general mass ingestion specification properties.
The following table describes the specification properties that you can review:
Property | Description |
|---|
Name | The name of the mass ingestion specification. |
Description | The description of the mass ingestion specification. |
Last modified time | The time that the mass ingestion specification was last modified. |
Last modified by | The last user who modified the mass ingestion specification. |
Deploy View
The Deploy view displays options to deploy and run the mass ingestion specification.
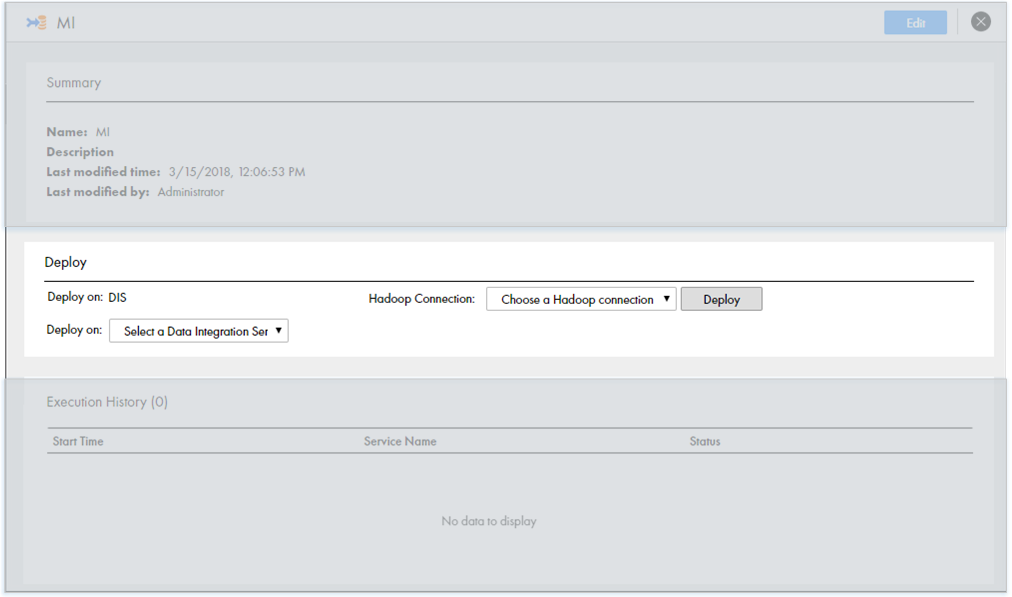
The following image shows the options that you can select in the Deploy view before you deploy a mass ingestion specification:
To deploy the specification, you select a Data Integration Service. When you select a Data Integration Service, the option to select a Hadoop connection appears.
After the mass ingestion specification is deployed, you can redeploy the specification using a different Hadoop connection or to a different Data Integration Service. The Data Integration Service uses the Hadoop connection to connect to the Hadoop environment. When the mass ingestion specification is deployed, you can run the specification from the Deploy view. When you run the specification, you have the option to select an operating system profile.
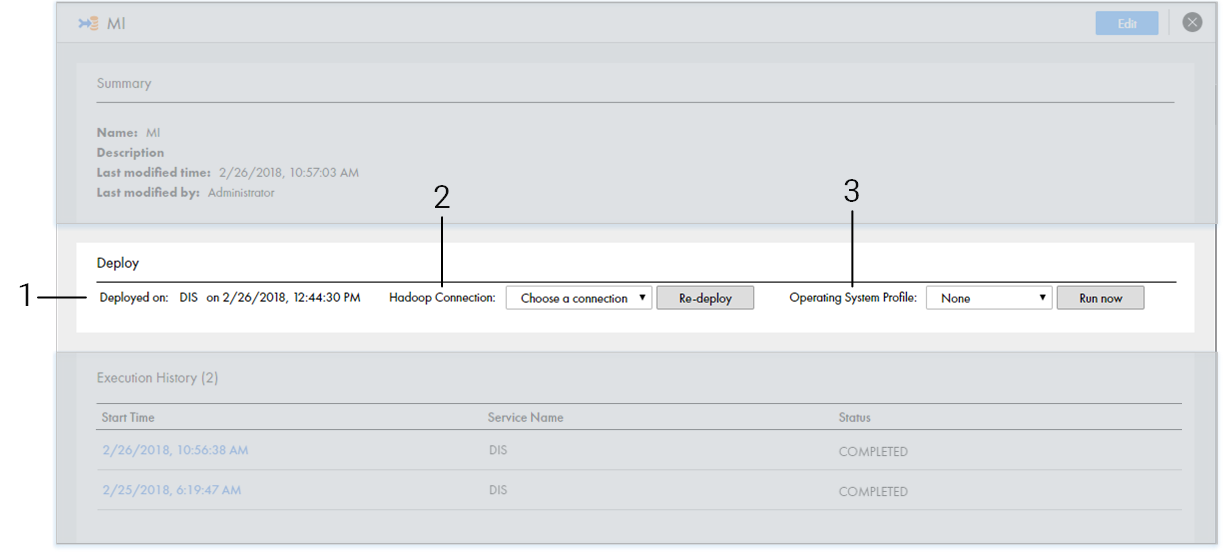
The following image shows the Deploy view after the mass ingestion specification has been deployed:
- 1. Deployed on. Displays the name of the Data Integration Service where the specification was deployed and the time that the specification was deployed.
- 2. Hadoop Connection. Select a Hadoop connection to redeploy the mass ingestion specification.
- 3. Operating System Profile. Select an operating system profile to run the mass ingestion specification. Default is None.
Execution History View
The Execution History view displays the run instances of the mass ingestion specification and information about each run instance.
The following table describes the run instance information that you can view in the Execution History view:
Property | Description |
|---|
Start Time | The time that the run instance is initiated. |
Service Name | The name of the Data Integration Service where the mass ingestion specification is deployed. |
Status | The run instance status. The status might display Completed, Failed, Running, Aborted, Canceled, Queued, or Unknown. |
The following table describes the status that might be displayed for each run instance:
Status | Description |
|---|
Completed | The run instance of the mass ingestion specification is completed. All data is ingested to the target successfully. |
Failed | The run instance of the mass ingestion specification failed. Some data failed to be ingested to the target. |
Running | The run instance of the mass ingestion specification is running. Some data is being ingested to the target. |
Aborted | The run instance of the mass ingestion specification is aborted. The run instance was aborted from the command line. |
Canceled | The run instance of the mass ingestion specification is canceled. The jobs to ingest some source tables in the mass ingestion specification are canceled on the Data Integration Service. |
Queued | The run instance of the mass ingestion specification is queued. The jobs to ingest some source tables in the mass ingestion specification are queued on the Data Integration Service. |
Unknown | The status of the mass ingestion specification run instance is unknown. The Mass Ingestion Service cannot fetch the status of the run instance. The status for the run instance might display Unknown in the following circumstances: - - A Model repository is not configured in the monitoring settings for the Mass Ingestion Service.
- - The Data Integration Service is disabled.
|
When you click the start time for a run instance in the Execution History view, you can see the Execution Statistics page for the specification run. On the Execution Statistics page, you can monitor the ingestion job statistics.
Execution Statistics Page
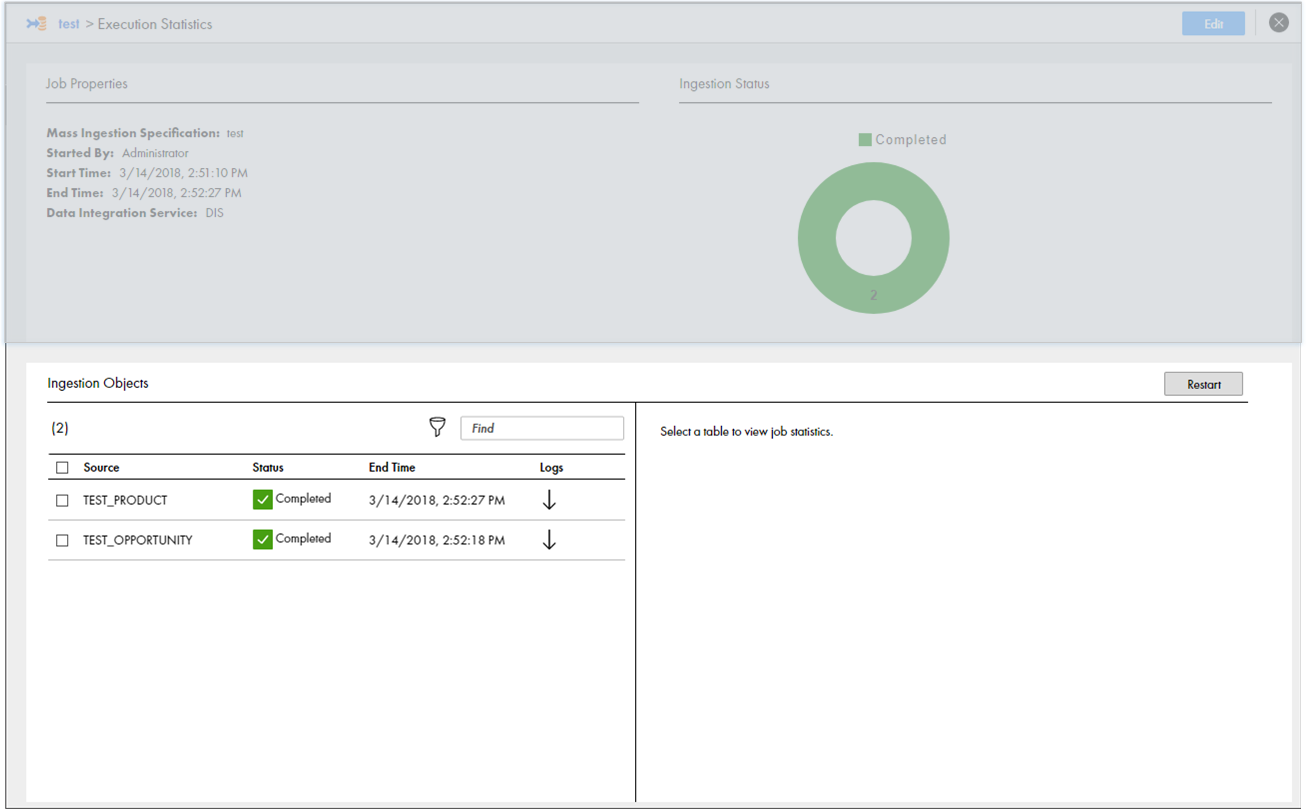
On the Execution Statistics page, view detailed information on the ingestion job for a mass ingestion specification run instance.
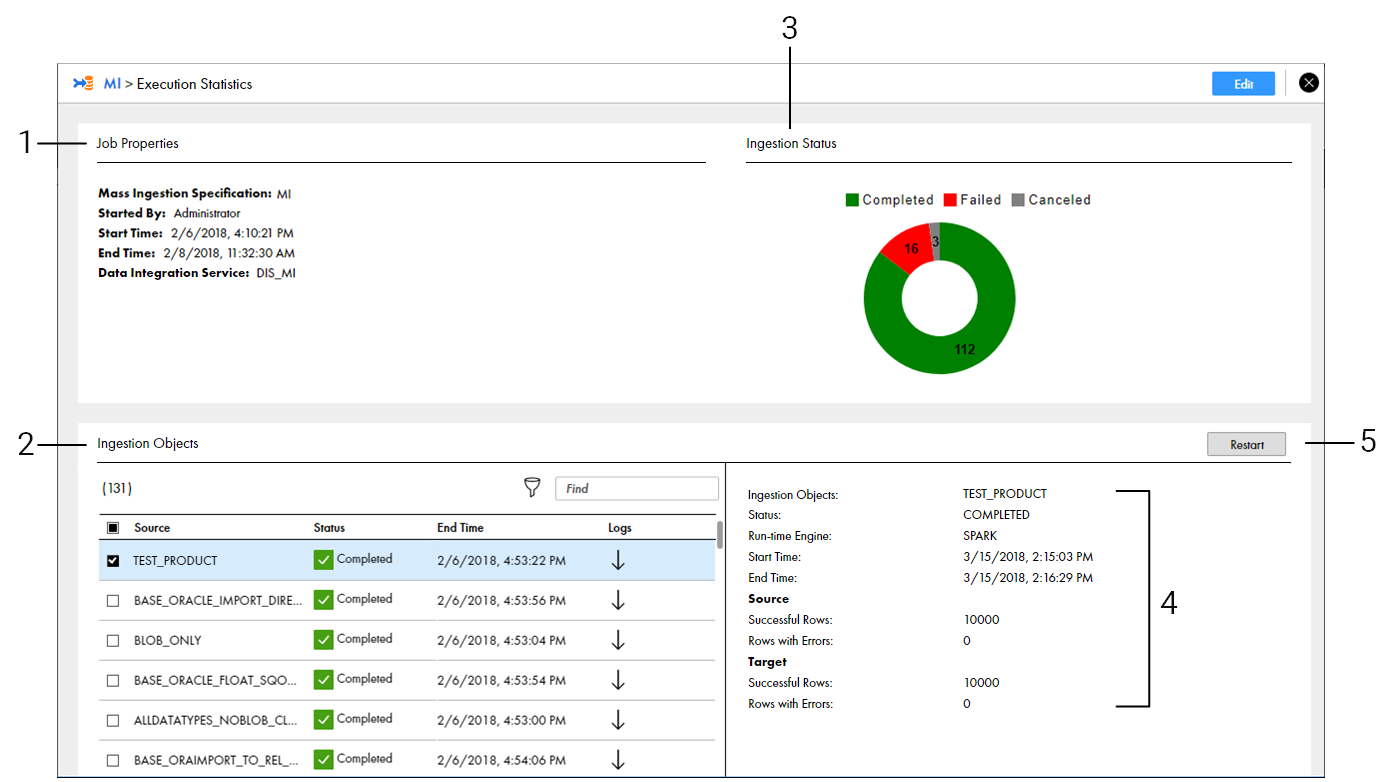
The following image shows the Execution Statistics page:
- 1. Job Properties. Displays general properties for the ingestion job.
- 2. Ingestion Objects. Lists the source tables that the job ingests to the target.
- 3. Ingestion Status. Displays a graphical representation of the ingestion job.
- 4. Ingestion Statistics. Lists the ingestion job statistics for a specific source table.
- 5. Restart. Restarts the ingestion job for ingestion objects.
Job Properties View
The Job Properties view describes general properties of the specification run instance.
The following table describes the properties that you can view in the Job Properties view:
Property | Description |
|---|
Mass Ingestion Specification | The name of the mass ingestion specification. |
Started By | The user who initiated the mass ingestion specification run. |
Start Time | The time that the ingestion job is initiated. |
End Time | The time that the ingestion job is completed. |
Data Integration Service | The name of the Data Integration Service where the mass ingestion specification is deployed. |
Ingestion Objects View
The Ingestion Objects view lists the source tables that are part of the ingestion job.
Use the Ingestion Objects view to monitor the tables that are ingested successfully and the tables that fail. If certain source tables fail to be ingested, restart the ingestion process for the failed tables.
The following table describes the properties that you can view in the Ingestion Objects view:
Property | Description |
|---|
Source | The name of the source table that is configured in the mass ingestion specification. |
Status | The ingestion status of the source table. The status might display Completed, Failed, Running, Canceled, Queued, Unknown, or Working. |
End Time | The time that the ingestion job for the source table is completed. |
Logs | The option to download the ingestion log for the source table. |
The following table describes the status that might be displayed for each source table:
Status | Description |
|---|
Completed | The ingestion job for the source table is completed. All data in the source table was ingested to the target successfully. |
Failed | The ingestion job for the source table failed. The data in the source table failed to be ingested to the target. |
Running | The ingestion job for the source table is running. Some data is being ingested to the target. |
Aborted | The ingestion job for the source table is aborted. The run instance of the mass ingestion specification that contains the ingestion job was aborted from the command line. |
Canceled | The ingestion job for the source table is canceled. The deployed mapping that performs the ingestion job is canceled on the Data Integration Service. |
Queued | The ingestion job for the source table is queued. The Mass Ingestion Service is waiting to schedule the deployed mapping that performs the ingestion job to run. |
Unknown | The status of the ingestion job for the source table is unknown. The Mass Ingestion Service cannot fetch the status of the source table. The status for the run instance might display Unknown in the following circumstances: - - A Model repository is not configured in the monitoring settings for the Mass Ingestion Service.
- - The Data Integration Service is disabled.
|
Working | The Mass Ingestion Service is fetching the status of the source table from the Data Integration Service. |
Ingestion Status View
The Ingestion Status view displays a graphical representation of the mass ingestion job.
The graphic summarizes the ingestion status listed in the Ingestion Objects view. The status for each source table might be Completed, Failed, Running, Canceled, Queued, Unknown, or Working.
Based on the ingestion status, you might decide to modify the specification . If you modify the specification and run the specification again, review the statistics on a unique Execution Statistics page for the run instance.
Ingestion Statistics View
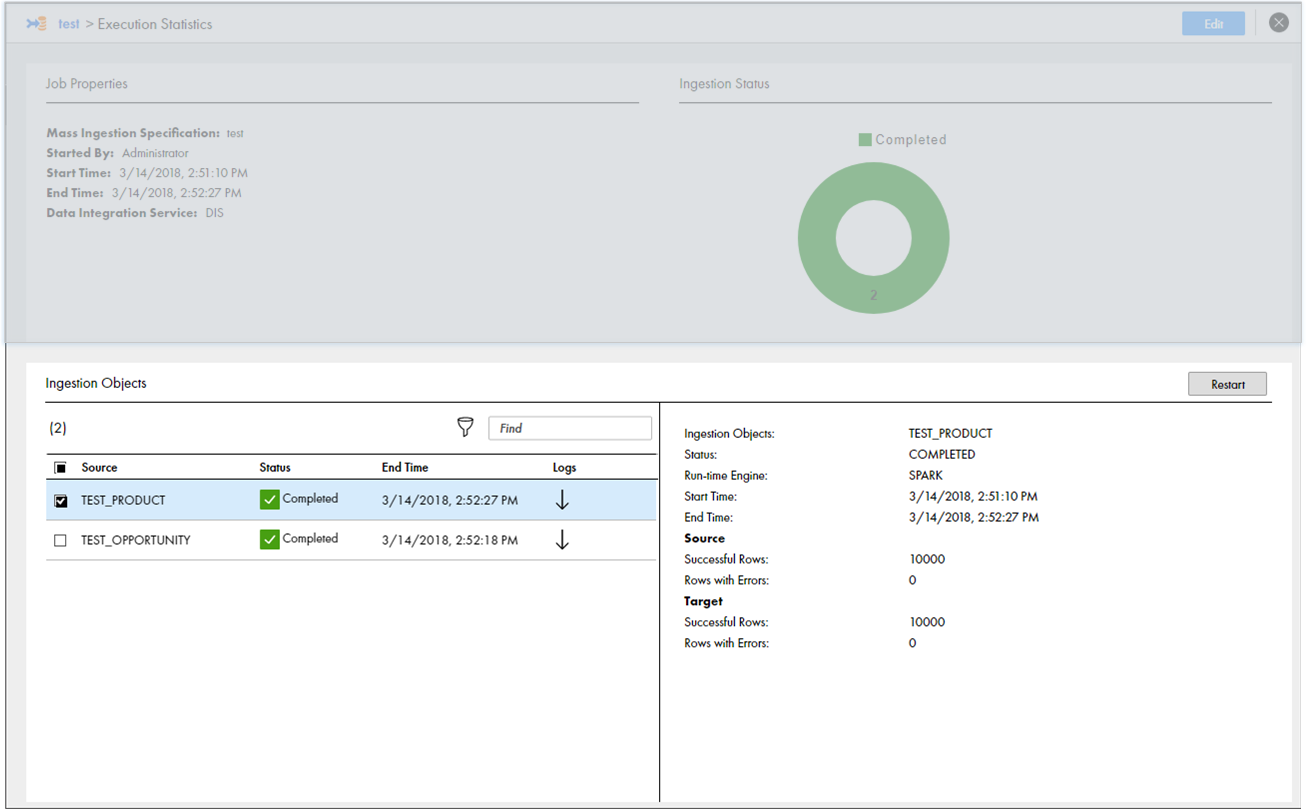
The Ingestion Statistics view lists the ingestion job statistics for a specific source table.
The following table describes the properties that you can view in the Ingestion Statistics view:
Property | Description |
|---|
Ingestion Objects | The name of the source table that is ingested. |
Status | The ingestion status of the source table. The status might display Completed, Failed, Running, Canceled, Queued, Unknown, or Working. |
Run-time Engine | The run-time engine in the Hadoop environment that performs the ingestion job. The run-time engine might be Blaze, Spark, or Hive. |
Start Time | The time that the ingestion job for the source table is initiated. |
End Time | The time that the ingestion job for the source table is completed. |
Source | The statistics for the table rows that are from the source database. View the number of rows that were ingested successfully and the number of rows that contain errors. |
Target | The statistics for the table rows that are ingested in the target. View the number of rows that were ingested successfully and the number of rows that contain errors. |
Monitoring Execution Statistics
Monitor the execution statistics for a mass ingestion specification run instance on the Execution Statistics page.
1. Browse to a mass ingestion specification in the Mass Ingestion tool.
The Overview page appears.
2. Select a run instance in the Execution History view to view the ingestion job statistics.
The Execution Statistics page appears for the run instance that you select.
3. On the Execution Statistics page, review the ingestion job.
4. In the Ingestion Objects view, select a source table to view statistics for the job that ingests the source table.
You can view ingestion statistics for one table at a time.
The statistics appear in the Ingestion Statistics view.
For example, the following image shows the different source tables that might appear in the Ingestion Objects view:
The following image shows the statistics that might appear in the Ingestion Statistics view for the first source table in the Ingestion Objects view:
Filtering Ingestion Objects by Status
Filter ingestion objects on the Execution Statistics page to find the specific tables that you want to monitor. You can filter the ingestion objects by the ingestion status.
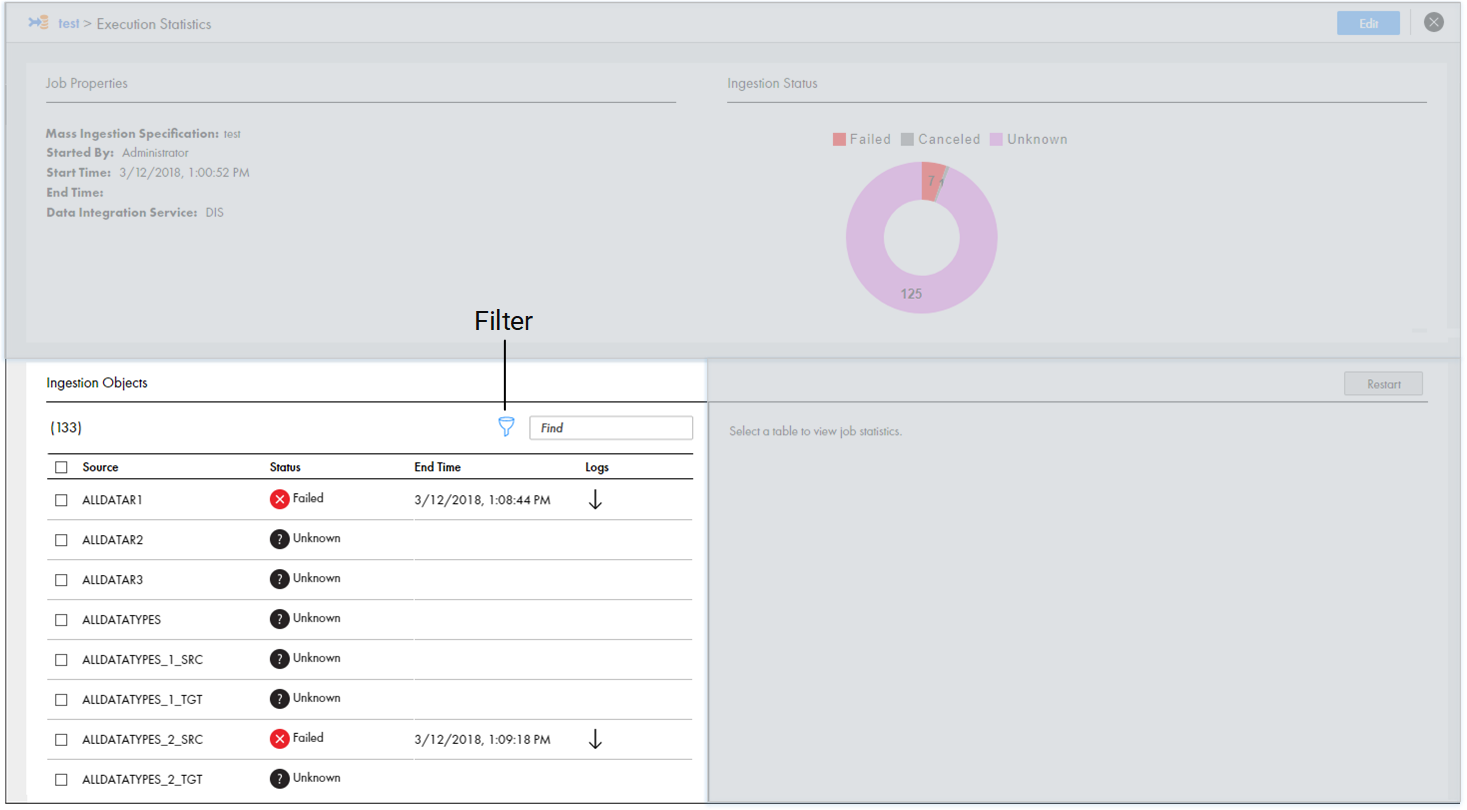
1. In the Ingestion Objects view on the Execution Statistics page, select the Filter icon.
The following image shows the Filter icon in the Ingestion Objects view:
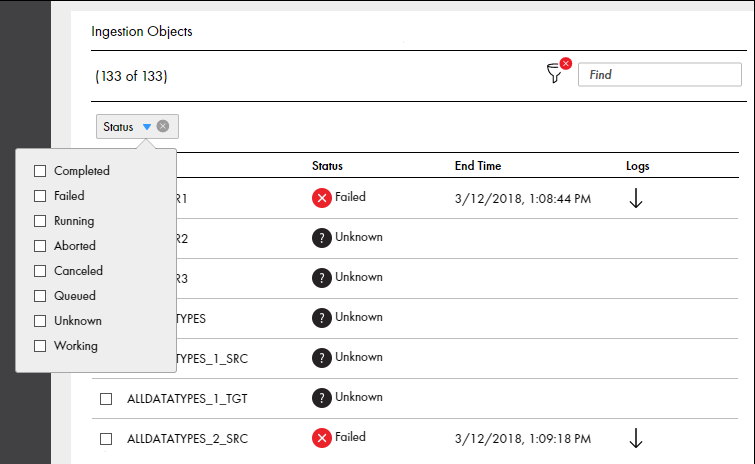
2. Select Status to filter the ingestion objects by the ingestion status.
The following image shows the Status option in the Ingestion Objects view:
3. Select the status that you want to use to filter the ingestion objects.
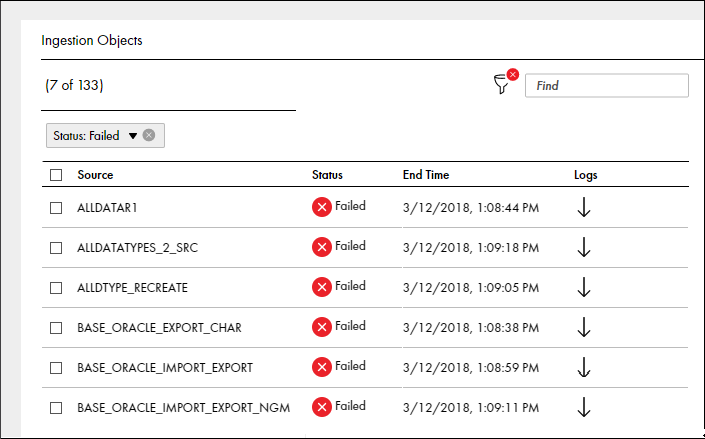
For example, you can select Failed. The following image shows the ingested objects filtered by Failed in the Ingestion Objects view:
Restart Ingestion Jobs
After the mass ingestion specification runs, you can restart the ingestion jobs for specific source tables.
For example, you might want to restart the ingestion job for a source table that failed to be ingested. Source tables might fail to be ingested due to a Hadoop configuration that is not compatible with the ingestion job, or they might fail if the ingestion target does not have enough space to consume the ingested tables. You might verify the Hadoop configuration or reconfigure the ingestion target. Then, you can restart the ingestion jobs for the tables that failed to be ingested.
To restart the ingestion jobs, perform one of the following tasks:
- •Restart Selected Objects. Restart the ingestion job only for the source tables that you select.
- •Restart Failed Objects. Restart the ingestion jobs for all source tables that failed to be ingested and all of the ingestion jobs that are canceled.
When you restart the ingestion jobs, you do not redeploy or rerun the entire mass ingestion specification. The ingestion status for the job refreshes and the status displays Working. The status continues to display Working until the Mass Ingestion Service fetches the ingestion status from the Data Integration Service.
Restarting Selected Ingestion Objects
Restart selected ingestion objects in the mass ingestion specification to restart the job to ingest the objects.
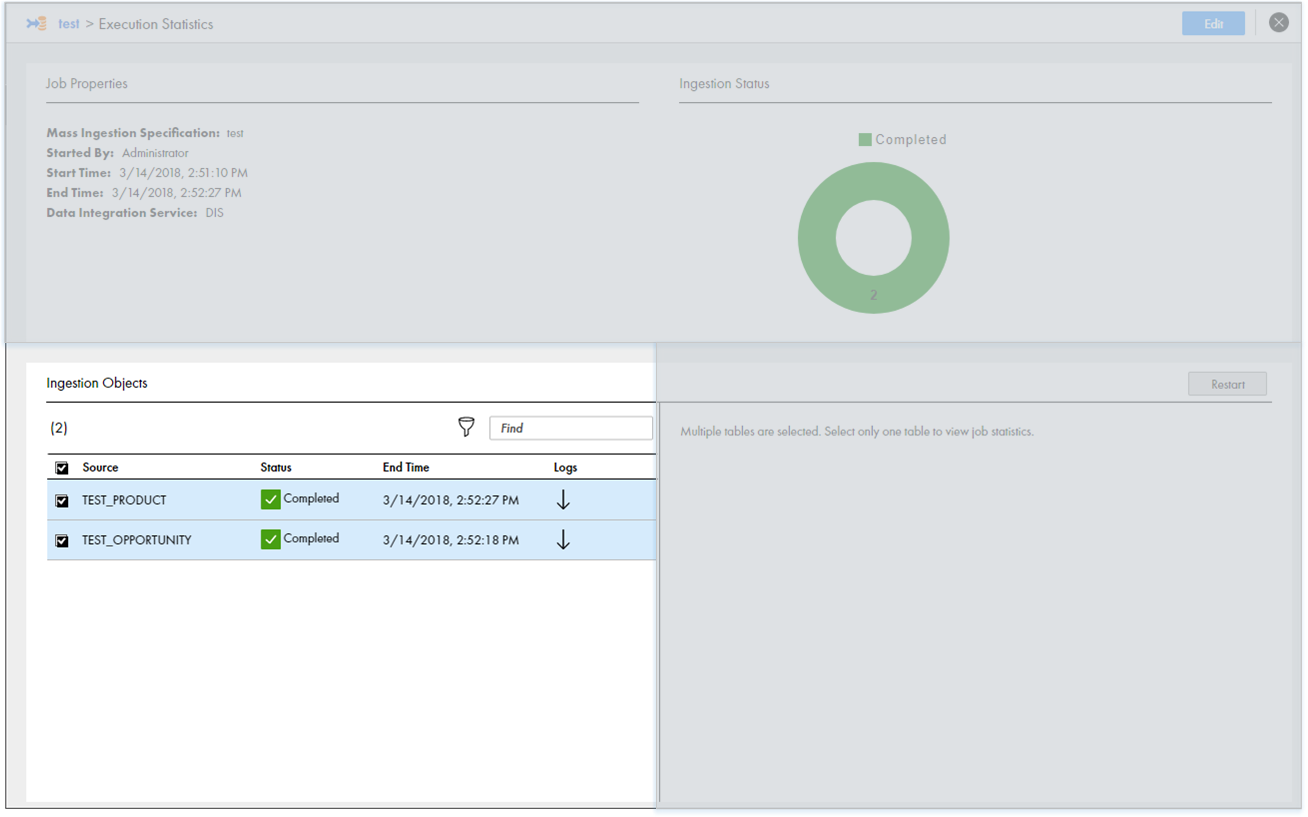
1. In the Ingestion Objects view on the Execution Statistics page, select the ingestion objects that you want to restart.
The following image shows several objects that are selected:
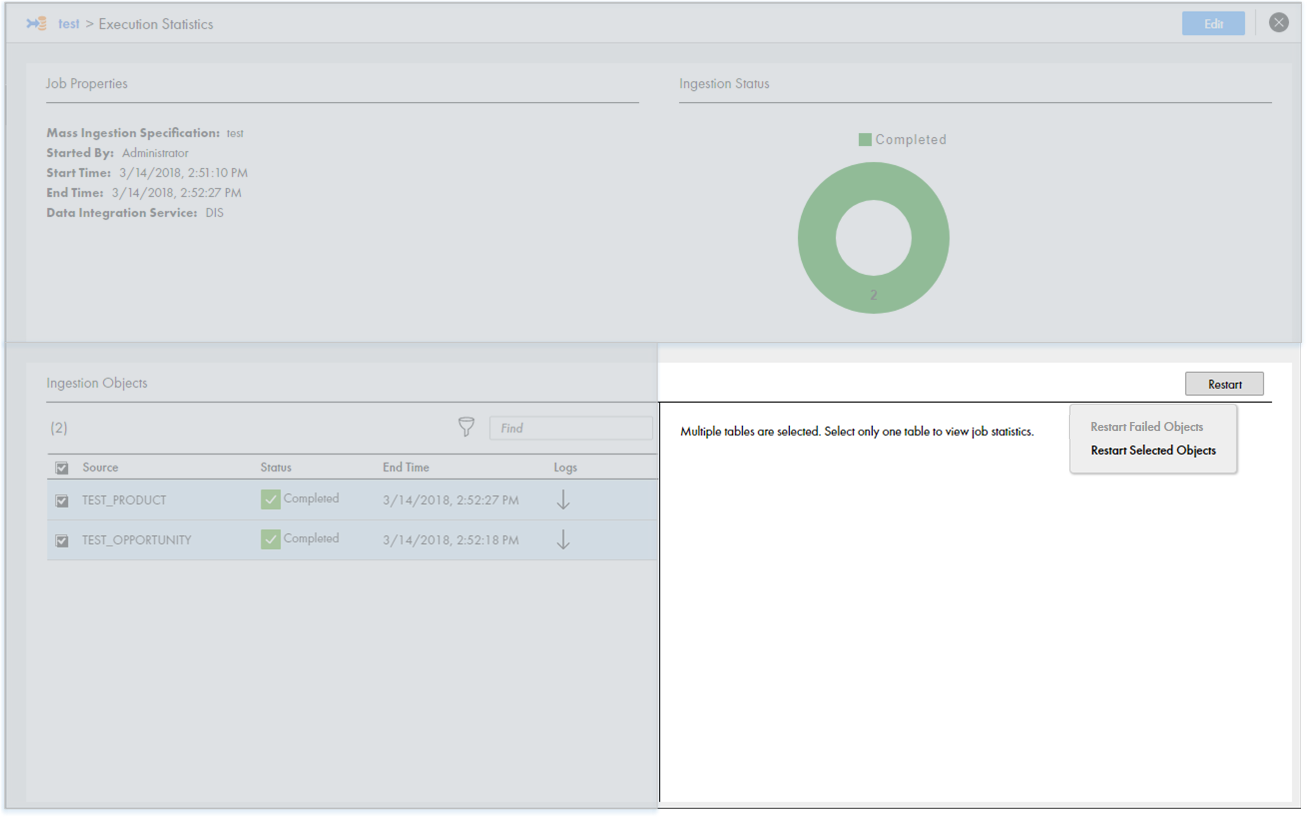
2. In the Ingestion Statistics view, select Restart.
The following image shows the Restart option:
3. Select Restart Selected Objects.
The ingestion job restarts for the selected objects.
Restarting Failed Ingestion Objects
You can choose to restart the ingestion objects to restart the job to ingest only the source tables that failed or were canceled.
Note: The option to restart failed ingestion objects does not restart the jobs that are aborted.
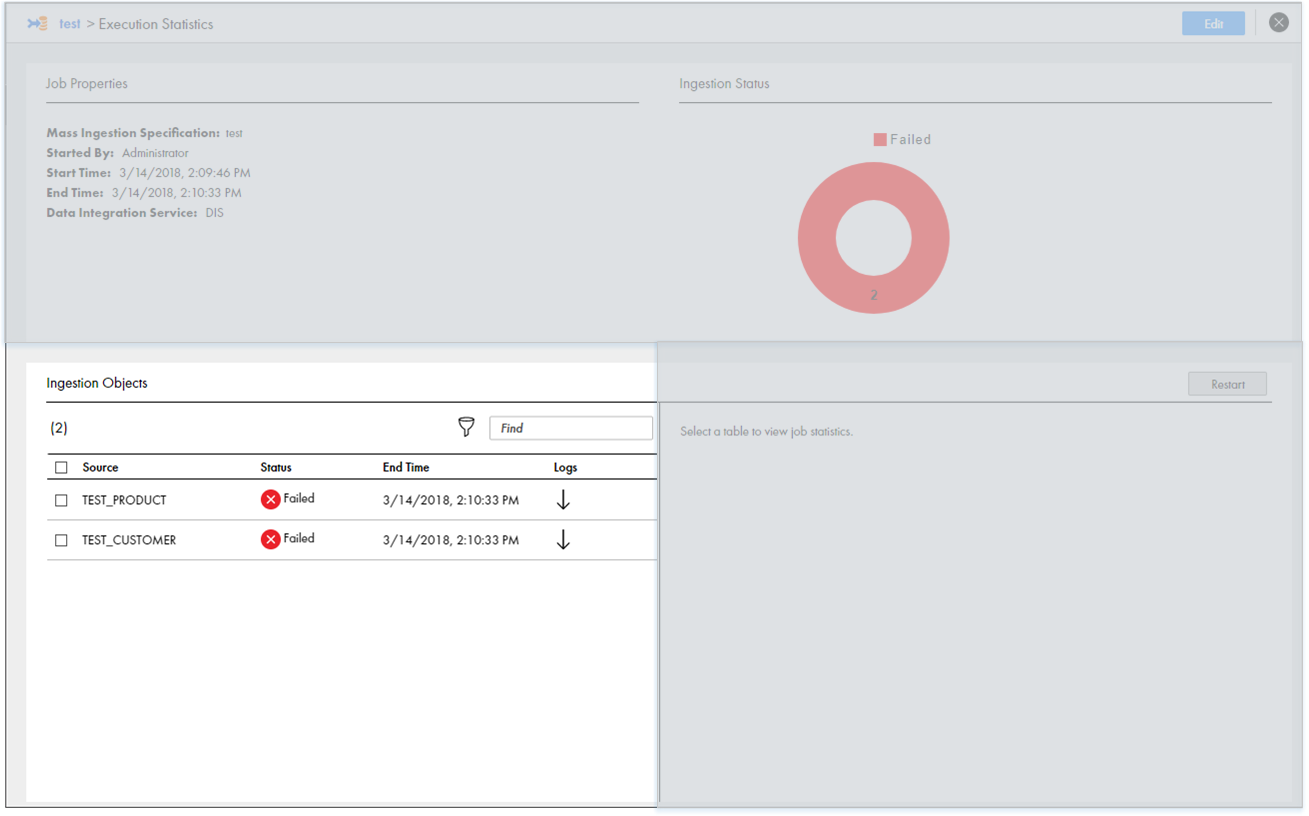
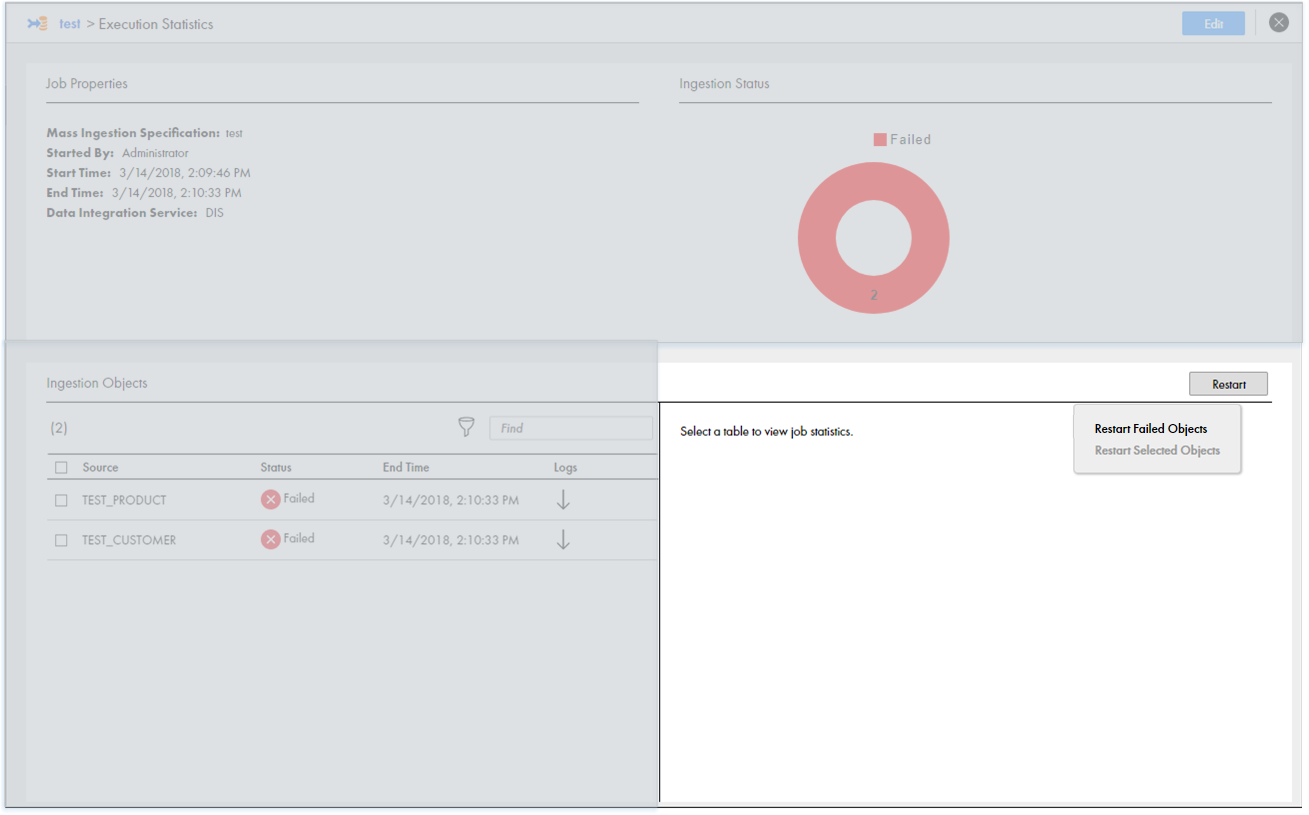
1. In the Ingestion Statistics view on the Execution Statistics page, select Restart.
The following image shows several objects that failed:
The following image shows the Restart option:
2. Select Restart Failed Objects.
The ingestion job restarts for all failed and canceled objects.
