Blaze Engine Monitoring
You can monitor statistics and view log events for a Blaze engine mapping job in the Monitor tab of the Administrator tool. You can also monitor mapping jobs for the Blaze engine in the Blaze Job Monitor web application.
The following image shows the Monitor tab in the Administrator tool:
The Monitor tab has the following views:
Summary Statistics
Use the Summary Statistics view to view graphical summaries of object states and distribution across the Data Integration Services. You can also view graphs of the memory and CPU that the Data Integration Services used to run the objects.
Execution Statistics
Use the Execution Statistics view to monitor properties, run-time statistics, and run-time reports. In the Navigator, you can expand a Data Integration Service to monitor Ad Hoc Jobs or expand an application to monitor deployed mapping jobs or workflows
When you select Ad Hoc Jobs, deployed mapping jobs, or workflows from an application in the Navigator of the Execution Statistics view, a list of jobs appears in the contents panel. The contents panel displays jobs that are in the queued, running, completed, failed, aborted, and cancelled state. The Data Integration Service submits jobs in the queued state to the cluster when enough resources are available.
The contents panel groups related jobs based on the job type. You can expand a job type to view the related jobs under it.
Access the following views in the Execution Statistics view:
- Properties
The Properties view shows the general properties about the selected job such as name, job type, user who started the job, and start time of the job. You can also monitor jobs on the Hadoop cluster from the Monitoring URL that appears for the mapping in the general properties. The Monitoring URL opens the Blaze Job Monitor in a web page. The Blaze Job Monitor displays detailed monitoring statistics for a mapping such as the number of grid tasks, grid segments, or tasklets, and recovery attempts for each tasklet.
- Blaze Execution Plan
The Blaze execution plan displays the Blaze engine script that the Data Integration Service generates based on the mapping logic. The execution plan includes the tasks that the script depends on. Each script has a unique identifier.
- Summary Statistics
The Summary Statistics view appears in the details panel when you select a mapping job in the contents panel. The Summary Statistics view displays throughput and resource usage statistics for the job.
You can view the following throughput statistics for the job:
- - Source. The name of the mapping source file.
- - Target name. The name of the target file.
- - Rows. The number of rows read for source and target. If the target is Hive, this is the only summary statistic available.
- - Average Rows/Sec. Average number of rows read per second for source and target.
- - Bytes. Number of bytes read for source and target.
- - Average Bytes/Sec. Average number of bytes read per second for source and target.
- - First Row Accessed. The date and time when the Data Integration Service started reading the first row in the source file.
- - Dropped rows. Number of source rows that the Data Integration Service did not read.
- Detailed Statistics
The Detailed Statistics view appears in the details panel when you select a mapping job in the contents panel. The Detailed Statistics view displays graphs of the throughput and resource usage statistics for the job run.
Blaze Job Monitoring Application
Use the Blaze Job Monitor application to monitor Blaze engine jobs on the Hadoop cluster.
You configure the host that starts the Blaze Job Monitor in the Hadoop connection properties. You might want to configure the Blaze Job Monitor address to avoid conflicts with other users on the same cluster, or if you have access to a limited number of nodes. If you do not configure the Blaze Job Monitor address, the Grid Manager starts the host on the first alphabetical cluster node with a default port of 9080.
The Blaze engine monitoring URL appears in the Monitor tab of the Administrator tool when you view a Blaze engine mapping job. When you click the URL, the Blaze engine monitoring application opens in a web page.
Note: You can also access the Blaze Job Monitor through the LDTM log. After the session load summary, the log displays a list of segments within the grid task. Each segment contains a link to the Blaze Job Monitor. Click on a link to see the execution details of that segment.
You configure the host that starts the Blaze Job Monitor in the Hadoop connection properties. The default address is <hostname>:9080.
The following image shows the Blaze Job Monitor:
Use the Task History panel on the left to filter Blaze mapping jobs by the following criteria:
- •Grid task. A parallel processing job request sent by the Blaze engine executor to the Grid Manager. You can further filter by all tasks, succeeded tasks, running tasks, or failed tasks.
- •Grid segment. Part of a grid mapping that is contained in a grid task.
- •Tasklet. A partition of a grid segment that runs on a separate DTM.
- •Tasklet Attempts. The number of recovery attempts to restart a tasklet. Click Log to view the mapping grid task log.
The Blaze Job Monitor displays the task history for mapping jobs with the same namespace. You can monitor properties for a task such as start time, end time, elapsed time, or state of the task. You can also view log events. If you filter mapping jobs by grid segment, you can mouse over a grid segment to view the logical name of the segment.
By default, the Blaze Job Monitor automatically refreshes the list of tasks every five seconds and reverts to the first page that displays tasks. Disable auto refresh if you want to browse through multiple pages. To turn off automatic refresh, click Action > Disable Auto Refresh.
The Blaze Job Monitor displays the first 100,000 grid tasks run in the past seven days. The Blaze Job Monitor displays the grid segments, tasklets, and tasklet attempts for grid tasks that are running and grid tasks that were accessed in the last 30 minutes.
Blaze Summary Report
The Blaze Summary Report displays more detailed statistics about a mapping job. In the Blaze Job Monitor, a green summary report button appears beside the names of successful grid tasks. Click the button to open the Blaze Summary Report.
Note: The Blaze Summary Report is available for technical preview. Technical preview functionality is supported but is unwarranted and is not production-ready. Informatica recommends that you use in non-production environments only.

Time Taken by Individual Segments
A pie chart visually represents the time taken by individual segments contained within a grid task.
When you click on a particular segment in the pie chart, the Selected Submapping table displays detailed information about that segment. The table lists the following segment statistics:
- •Task Name. The logical name of the selected segment.
- •Segment Execution Time. The time taken by the selected segment.
- •# Tasklets. The number of tasklets in the selected segment.
- •Minimum Tasklet Execution Time. The execution time of the tasklet within the selected segment that took the shortest time to run.
- •Maximum Tasklet Execution Time. The execution time of the tasklet within the selected segment that took the longest time to run.
- •Average Tasklet Execution Time. The average execution time of all tasklets within the selected segment.
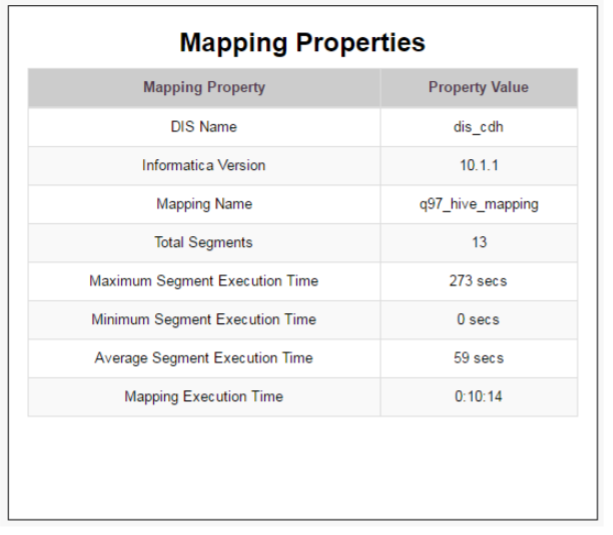
Mapping Properties
The Mapping Properties table lists basic information about the mapping job.
The Mapping Properties table displays the following information:
- •The DIS name under which the mapping was run.
- •The Informatica version.
- •The name of the mapping.
- •The total number of segments for the mapping.
- •The execution time of the segment that took the longest time to run.
- •The execution time of the segment that took the shortest time to run.
- •The average execution time of all segments.
- •The total mapping execution time.
Tasklet Execution Time
A time series graph displays the execution time of all tasklets within the selected segment.
The x-axis represents the tasklet start time and the y-axis represents the actual tasklet execution time. The red dashed line represents the average execution time for all tasklets, and the two red markers show the minimum and maximum execution times within the segment.
Selected Tasklet Information
When you select a tasklet from the Tasklet Execution Time graph, you can see more data about that individual tasklet. This data includes source and target row counts as well as cache information for any cache-based transformation processed by the tasklet. Click the Get Detailed Log button to see a full log of the selected tasklet.
Blaze Engine Logs
The mapping run log appears in the LDTM log on the domain and in the tasklet logs on the Hadoop cluster.
You can find information about the mapping run on the Blaze engine in the following log files:
- LDTM log
- The LDTM logs the results of the mapping run on the Blaze engine. You can view the LDTM log from the Developer tool or the Monitoring tool for a mapping job.
You can configure the Data Integration Service to log details about the mapping execution to the session log. To enable logging of LDTM mapping execution details, set the log tracing level to verbose initialization or verbose data.
Note: Informatica recommends setting the tracing level to verbose data only for debugging. Do not use verbose data to run jobs concurrently for production.
Mapping execution details include the following information:
- - Start time, end time, and state of each task
- - Blaze Job Monitor URL
- - Number of total, succeeded, and failed/cancelled tasklets
- - Number of processed and rejected rows for sources and targets
- - Data errors, if any, for transformations in each executed segment
- Blaze component and tasklet logs
The Blaze engine stores tasklet and Blaze component log events in temporary and permanent directories on the Hadoop cluster.
The following list describes Blaze log properties and where to configure them:
- infagrid.node.local.root.log.dir
- Temporary directory for tasklet and component logs. An administrator must create a directory with read, write, and execute permissions on all nodes on the Hadoop cluster.
- Configure this property in the Advanced properties of the Blaze configuration in the Hadoop connection. Default is /tmp/infa/logs/blaze.
- Blaze Staging Directory
- Permanent directory on HDFS that contains tasklet log event.
- Configure this property in the Blaze Configuration properties of the Hadoop connection.
- infagrid.delete.local.log
- Boolean property to determine whether to delete tasklet logs from the temporary directory after copying the logs to the permanent directory.
- Configure this property in the Advanced properties of the Blaze configuration in the Hadoop connection. To retain the logs in the temporary directory, set to false. Default is true.
- yarn.nodemanager.local-dirs
- Directory for the DTM process. The Data Integration Service stores logs in this location if you do not configure the infagrid.node.local.root.log.dir or Blaze Staging Directory properties.
- This property is configured by default when the cluster configuration is imported.
Viewing Blaze Logs
You can view logs for a Blaze mapping from the Blaze Job Monitor.
1. In the Blaze Job Monitor, select a job from the list of jobs.
2. In the row for the selected job, click the Logs link.
The log events appear in another browser window.
Orchestrator Sunset Time
Orchestrator sunset time is the maximum lifetime for an Orchestrator service. Sunset time determines the maximum amount of time that the Blaze engine can run a mapping job. The default sunset time is 24 hours. After 24 hours, the Orchestrator shuts down, which causes the Blaze Grid Manager to shut down.
You can configure the Orchestrator sunset time to be greater than or less than 24 hours. Configure the following property in the Hadoop connection:
Property | Description |
|---|
infagrid.orchestrator.svc.sunset.time | Maximum lifetime for an Orchestrator service, in hours. Default is 24 hours. |
You can also disable sunset by setting the property to 0 or a negative value. If you disable sunset, the Orchestrator never shuts down during a mapping run.
Troubleshooting Blaze Monitoring
- When I run a mapping on the Blaze engine and try to view the grid task log, the Blaze Job Monitor does not fetch the full log.
- The grid task log might be too large. The Blaze Job Monitor can only fetch up to 2 MB of an aggregated log. The first line of the log reports this information and provides the location of the full log on HDFS. Follow the link to HDFS and search for "aggregated logs for grid mapping." The link to the full log contains the grid task number.
- The Blaze Job Monitor will not start.
- Check the Hadoop environment logs to locate the issue. If you do not find an issue, stop the Grid Manager with the infacmd stopBlazeService command and run the mapping again.
- The Monitoring URL does not appear in the Properties view of the Administrator tool.
- Locate the URL in the YARN log.
- When Blaze processes stop unexpectedly, Blaze does not save logs in the expected location.
- When Blaze stops unexpectedly, you can access Blaze service logs through the YARN monitor. Use one of these methods:
- - The Grid Manager log contains all Blaze job container IDs and identifies the host on which Blaze ran. Alter the Grid Manager log URL with the container ID and host name of the Blaze host.
- - Run the command yarn logs -applicationID <Blaze Grid Manager Application ID>.
- A Blaze Job Monitor that has been running for several days loses its connection to the Application Timeline Server on the Hortonworks cluster.
- The Blaze engine requires a running Application Timeline Server on the cluster. When the Blaze engine starts a mapping run, the Blaze Job Monitor checks the state of the Application Timeline Server. The Grid Manager will start it if it is not running. When the connection to the Application Timeline Server is lost, the Blaze engine attempts to reconnect to it. If the Application Timeline Server stops during a Blaze mapping run, you can restart it by restarting the Grid Manager.
Note: When the Application Timeline Server is configured to run on the cluster by default, the cluster administrator must manually restart it on the cluster.
- When a mapping takes more than 24 hours to execute, the mapping fails.
- When mappings run on the Blaze engine for more than 24 hours, some mappings might fail because the Orchestrator service has a default sunset time of 24 hours. After 24 hours, the Orchestrator shuts down, which causes the Blaze Grid Manager to shut down.
To increase the sunset time to be more than 24 hours, configure the following property in the Hadoop connection advanced properties:
infagrid.orchestrator.svc.sunset.time=[HOURS]
You can also disable sunset by setting the property to 0 or a negative value. If you disable sunset, the Blaze Grid Manager never shuts down.