Hadoop Environment Logs
The Data Integration Service generates log events when you run a mapping in the Hadoop environment.
You can view logs for the Blaze engine, the Spark engine, or the MapReduce or Tez Hive engines. You can view log events relating to different types of errors such as Hadoop connection failures, Hive query failures, Hive command failures, or other Hadoop job failures.
When you run a mapping on the Spark engine, you can view the Scala code in logs that the Logical Data Translation Generater generates from the Informatica mapping.
You can view reject files in the reject file directory specified for the Data Integration Service.
YARN Web User Interface
You can view the applications that ran on a cluster in the YARN web user interface. Click the Monitoring URL for Blaze, Hive, or Spark jobs to access the YARN web user interface.
Blaze, Spark, and Hive engines run on the Hadoop cluster that you configure in the Hadoop connection. The YARN web user interface shows each job that the engine runs as a YARN application.
The following image shows the Application Monitoring page of the YARN web user interface:
The Application Type indicates which engine submitted the YARN application.
The application ID is the unique identifier for the application. The application ID is a link to the application summary. The URL is the same as the Monitoring URL in the Administrator tool.
Click the Logs link in the application summary to view the application logs on the Hadoop cluster.
The amount of information in the application logs depends on the tracing level that you configure for a mapping in the Developer tool. The following table describes the amount of information that appears in the application logs for each tracing level:
Tracing Level | Messages |
|---|
None | The log displays FATAL messages. FATAL messages include non-recoverable system failures that cause the service to shut down or become unavailable. |
Terse | The log displays FATAL and ERROR code messages. ERROR messages include connection failures, failures to save or retrieve metadata, service errors. |
Normal | The log displays FATAL, ERROR, and WARNING messages. WARNING errors include recoverable system failures or warnings. |
Verbose initialization | The log displays FATAL, ERROR, WARNING, and INFO messages. INFO messages include system and service change messages. |
Verbose data | The log displays FATAL, ERROR, WARNING, INFO, and DEBUG messages. DEBUG messages are user request logs. |
Accessing the Monitoring URL
The Monitoring URL opens the Blaze Job Monitor web application or the YARN web user interface. Access the Monitoring URL from the Execution Statistics view in the Administrator tool.
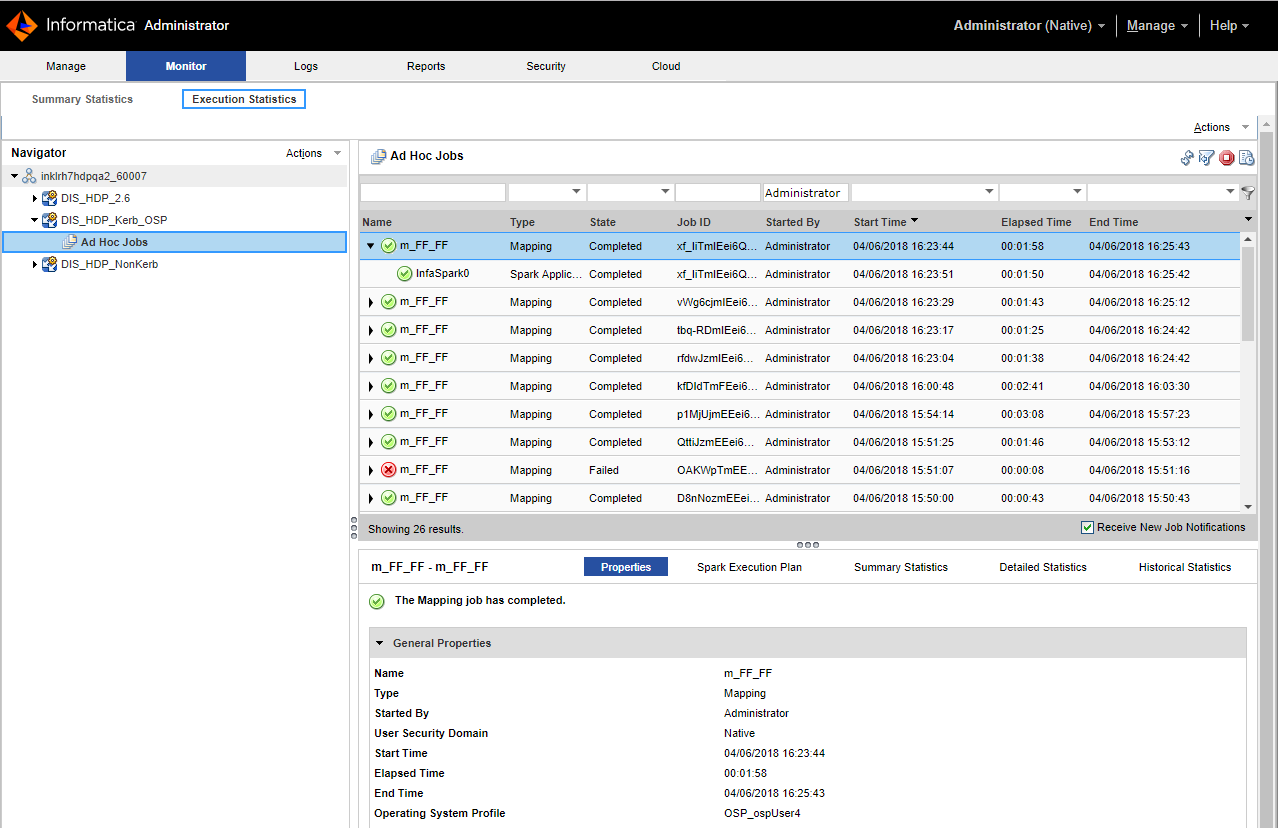
1. In the Monitor tab of the Administrator tool, click the Execution Statistics view.
2. Select Ad Hoc Jobs or select a deployed mapping job or workflow from an application in the Navigator.
The list of jobs appears in the contents panel.
3. Select a mapping job and expand the mapping to select a grid task for the mapping.
The Monitoring URL appears in the Properties view.
Viewing Hadoop Environment Logs in the Administrator Tool
You can view log events for a Blaze or Hive mapping from the Monitor tab of the Administrator tool.
1. In the Administrator tool, click the Monitor tab.
2. Select the Execution Statistics view.
3. In the Navigator, choose to open an ad hoc job, a deployed mapping job, or a workflow.
- - To choose an ad hoc job, expand a Data Integration Service and click Ad Hoc Jobs.
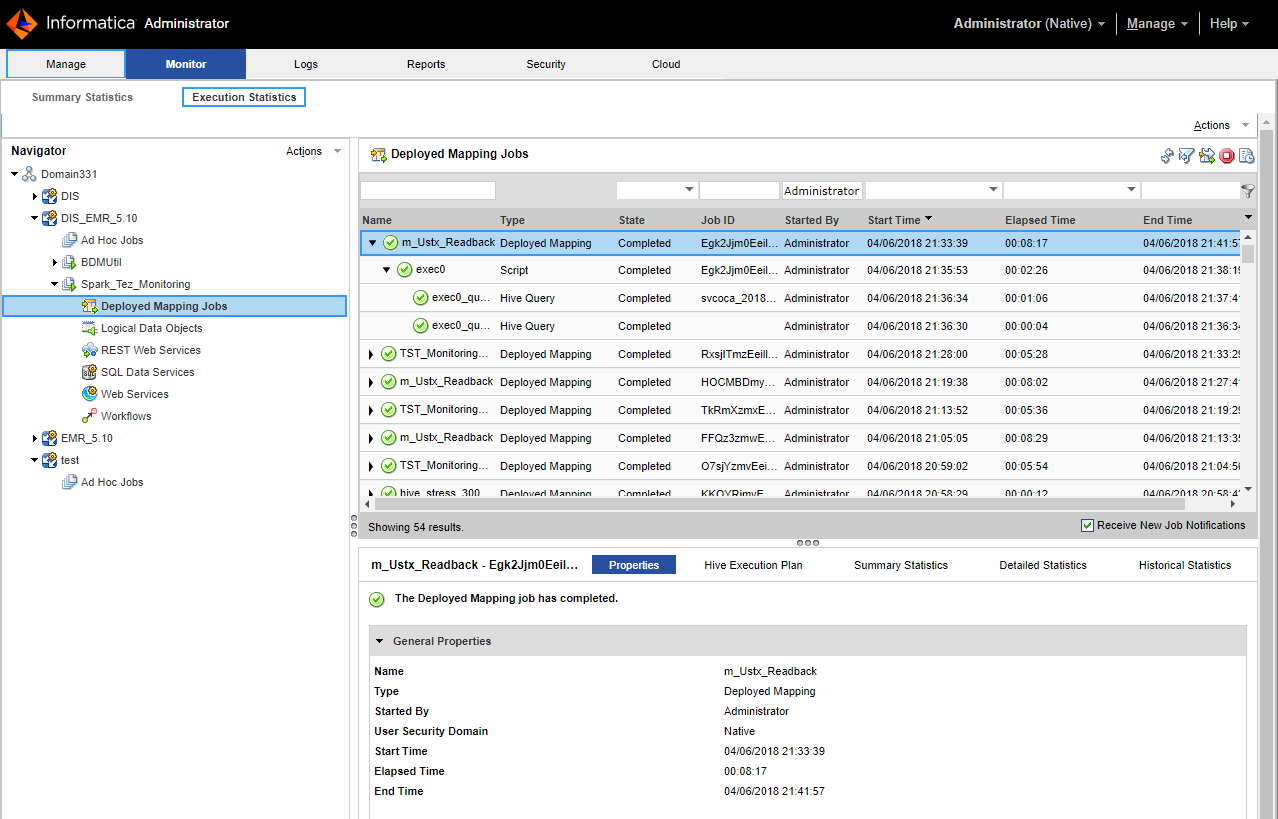
- - To choose a deployed mapping job, expand an application and click Deployed Mapping Jobs.
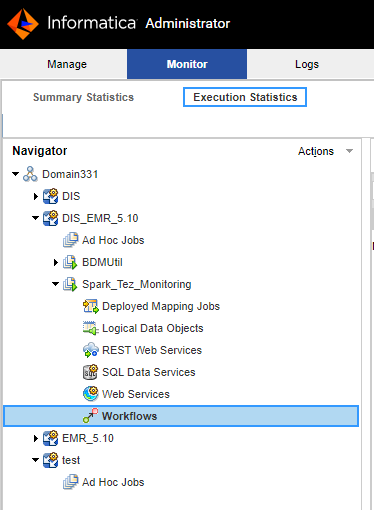
- - To choose a workflow, expand an application and click Workflows.
The list of jobs appears in the contents panel.
4. Click Actions > View Logs for Selected Object to view the run-time logs for the mapping.
The log file shows the results of the Hive queries and Blaze engine queries run by the Data Integration Service. This includes the location of Hive session logs and Hive session history file.
Monitoring a Mapping
You can monitor a mapping that runs in the Hadoop environment.
1. In the Administrator tool, click the Monitor tab.
2. Select the Execution Statistics view.
3. In the Navigator, choose to open an ad hoc job, a deployed mapping job, or a workflow.
- - To choose an ad hoc job, expand a Data Integration Service and click Ad Hoc Jobs.
- - To choose a deployed mapping job, expand an application and click Deployed Mapping Jobs.
- - To choose a workflow, expand an application and click Workflows.
The list of jobs appears in the contents panel.
4. Click a job to view its properties.
The contents panel shows the default Properties view for the job. For a Blaze engine mapping, the Blaze engine monitoring URL appears in the general properties in the details panel. The monitoring URL is a link to the YARN web user interface for Spark jobs.
5. Choose a view in the contents panel to view more information about the job:
- - To view the execution plan for the mapping, select the Execution Plan view.
- - To view the summary statistics for a job, click the Summary Statistics view.
- - To view the detailed statistics for a job, click the Detailed Statistics view.
Note: You can view the number of rows processed in the Summary Statistics for a Hive source or target. The remaining values do not appear for Hive sources and targets.