Hive Engine Monitoring
You can monitor statistics and view log events for a Hive engine mapping job in the Monitor tab of the Administrator tool.
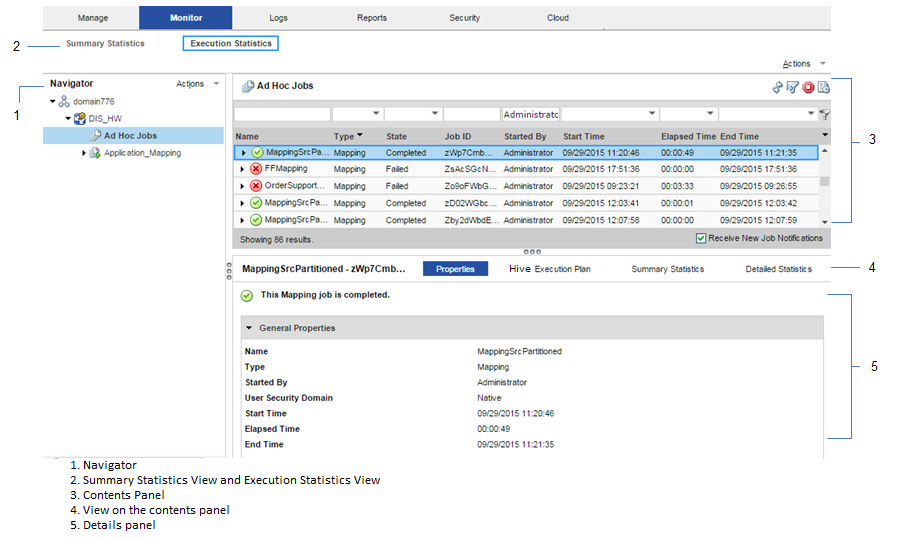
The following image shows the Monitor tab in the Administrator tool:
The Monitor tab has the Summary Statistics and Execution Statistics views.
Summary Statistics
Use the Summary Statistics view to view graphical summaries of object states and distribution across the Data Integration Services. You can also view graphs of the memory and CPU that the Data Integration Services used to run the objects.
Execution Statistics
Use the Execution Statistics view to monitor properties, run-time statistics, and run-time reports. In the Navigator, you can expand a Data Integration Service to monitor Ad Hoc Jobs or expand an application to monitor deployed mapping jobs or workflows
When you select Ad Hoc Jobs, deployed mapping jobs, or workflows from an application in the Navigator of the Execution Statistics view, a list of jobs appears in the contents panel. The contents panel displays jobs that are in the queued, running, completed, failed, aborted, and cancelled state. The Data Integration Service submits jobs in the queued state to the cluster when resources are available.
The contents panel groups related jobs based on the job type. You can expand a job type to view the related jobs under it.
Access the following views on the content panel under the Execution Statistics view:
- •Properties
- •Hive Execution Plan
- •Summary Statistics
- •Detailed Statistics
Properties
The Properties view on the content panel shows the general properties about the selected job such as name, job type, user who started the job, and start time of the job.
Hive Execution Plan
The Hive execution plan displays the Hive script that the Data Integration Service generates based on the mapping logic. The execution plan includes the Hive queries and Hive commands. Each script has a unique identifier.
Summary Statistics
The Summary Statistics view appears in the details panel when you select a mapping job in the contents panel. The Summary Statistics view displays throughput and resource usage statistics for the job.
You can view the following throughput statistics for the job:
- •Source. The name of the mapping source instance.
- •Target name. The name of the target instance.
- •Rows. The number of rows read for source and target. If the target is Hive, this is the only summary statistic available.
- •Average Rows/Sec. Average number of rows read per second for source and target.
- •Bytes. Number of bytes read for source and target.
- •Average Bytes/Sec. Average number of bytes read per second for source and target.
- •First Row Accessed. The date and time when the Data Integration Service started reading the first row in the source file.
- •Dropped rows. Number of source rows that the Data Integration Service did not read.
You can view the throughput statistics for the job in the details pane in the following image:
The Hive summary statistics include a row called "AllHiveSourceTables." This row includes records read from the following sources for the MapReduce engine:
- •Original Hive sources in the mapping.
- •Staging Hive tables defined by the Hive engine.
- •Staging data between two linked MapReduce jobs in each query.
If the LDTM session includes one Tez job, the "AllHiveSourceTables" statistics only includes original Hive sources in the mapping.
Note: The AllHiveSourceTables statistics only includes the original Hive sources in a mapping for the Tez job.
When a mapping contains customized data objects or logical data objects, the summary statistics display the original source data instead of the customized data objects or logical data objects in the Administrator tool and in the session log. The Hive driver reads data from the original source data.
You can view the Tez job statistics in the Administrator tool when reading and writing to Hive tables that the Spark engine launches in any of the following scenarios:
- •You have resources present in the Amazon buckets.
- •You have transactional Hive tables.
- •You have table columns secured with fine-grained SQL authorization.
Incorrect statistics appears for all the Hive sources and targets indicating zero rows for average rows for each second, bytes, average bytes for each second, and rejected rows. You can see that only processed rows contain correct values, and the remaining columns will contain either 0 or N/A.
When an Update Strategy transformation runs on the Hive engine, the Summary Statistics for the target table instance combines the number of inserted rows processed, deleted rows processed, and twice the number of updated rows processed. The update operations are handled as separate delete and insert operations.
Detailed Statistics
The Detailed Statistics view appears in the details panel when you select a mapping job in the contents panel. The Detailed Statistics view displays graphs of the throughput and resource usage statistics for the job run.
Monitoring with MapReduce Hive Engine
You can monitor the MapReduce Hive engine.
You can also monitor and view Hive tasks that use MapReduce to run Spark jobs. Or, you can monitor MapReduce engines for Hive mappings.
Note: Effective in version 10.2.1, the MapReduce mode of the Hive run-time engine is deprecated, and Informatica will drop support for it in a future release. The Tez mode remains supported.
The following image shows the MapReduce Hive Query properties on the Monitor tab in the Administrator tool:
The following image shows a Hive task that uses MapReduce to run Spark jobs:
You can view the following information under the MR Job details for MapReduce:
Property | Applicable Values | Description |
|---|
Job ID | Job_<name> | You can select the link under Job ID to view the application cluster For example, if the Job ID property contains a value starting with the prefix job_ in the MR Job Details pane, the naming convention indicates that the MapReduce engine is in use. |
Map % Complete | 0 - 100 | You can specify a value from 0 through 100 for MapReduce. |
Reduce % Complete | 0 - 100 | You can specify a value from 0 through 100 for MapReduce. |
DAG % Complete | N/A | DAG % is not applicable for MapReduce. |
Monitoring with Tez Hive Engine
You can monitor Tez Hive engine.
Tez uses YARN timeline as its application history store. Tez stores most of its lifecycle information into the history store, such as all the DAG information. You can monitor the Tez engine information, such as DAG % complete.
Tez relies on the application time line server as a backing store for the application data generated during the lifetime of a YARN application. Tez interfaces with the application timeline server and displays both a live and historical view of the Tez application inside a Tez web application.
The following image shows the Tez Hive Query properties on the Monitor tab in the Administrator tool:
You can monitor and view Hive tasks that use Tez to run Spark jobs. Or, you can monitor Tez engines for Hive mappings.
The following image shows a Hive task that uses Tez to run Spark jobs:
You can view the following information under the MR Job details for Tez:
Property | Applicable Values | Description |
|---|
Job ID | Application_<name> | You can select the link under Job ID to view the application cluster. For example, if the Job ID property contains a value starting with the prefix application_ in the MR Job Details pane, the naming convention indicates that the Tez engine is in use. You can click the link under Job ID to view the application cluster. If you click the Tracking URL for the Tez job, you get redirected to the Hadoop Resource Manager. If you then click History, you can view the Tez view, which is provided by the Hadoop distribution in Ambari. For each application ID, there are multiple DAGs information. |
Map % Complete | N/A | Map % is not applicable for Tez. |
Reduce % Complete | N/A | Reduce % is not applicable for Tez. |
DAG % Complete | 0 - 100 | You can specify a value from 0 through 100 for Tez. |
When you specify a query in Hive, the script launches a Hadoop job, such as INSERT or DELETE query. Or, the script launches a Hive query. If the script launches no Hadoop jobs, it appears blank for the following fields, such as Job ID, reduce % complete, and DAG % complete.
Note: If the active Resource Manager goes down during a mapping run on the Tez engine, the Tez monitoring statistics might become unavailable for Hive jobs or Spark jobs that use HiveServer 2 tasks.
Hive Engine Logs
The Hive engine logs appear in the LDTM log and the Hive session log.
You can find the information about Hive engine log events in the following log files:
- LDTM log
- The LDTM logs the results of the Hive queries run for the mapping. You can view the LDTM log from the Developer tool or the Administrator tool for a mapping job.
- Hive session log
When you have a Hive script in the Hive execution plan of a mapping, the Data Integration Service opens a Hive session to run the Hive queries.
A Hive session updates a log file in the following directory on the Data Integration Service node:
<Informatica installation directory>/tomcat/bin/disTemp/.
The full path to the Hive session log appears in the LDTM log.
- You can view information about DAG vertices in the Tez job link and in the session log. The Tez layout and views might differ based on the selected configurations for the Tez specific properties.
- The following image shows the Tez Hive query properties in Tez:
- The following image shows the advanced Tez properties in Tez:
The following image shows the advanced Tez properties related to DAG, vertex, and task counts:
- The monitoring properties appear in the Hive session log under Mapping Status Report when enabled for verbose data or verbose initialization for Tez.
To get DAG tracking URL in the workflow log, you have to update the tez.tez-ui.history-url.base with the following value in the HDInsights cluster:
<host address>:<port>/#/main/view/TEZ/tez_cluster_instance.
For example, a complete DAG URL is as follows:
https://ivlhdp584.informatica.com:8443/#/main/view/TEZ/tez_cluster_instance?viewPath=%2F%23%2Fdag%2Fdag_1520917602092_9282_1