Spark Engine Monitoring
You can monitor statistics and view log events for a Spark engine mapping job in the Monitor tab of the Administrator tool. You can also monitor mapping jobs for the Spark engine in the YARN web user interface.
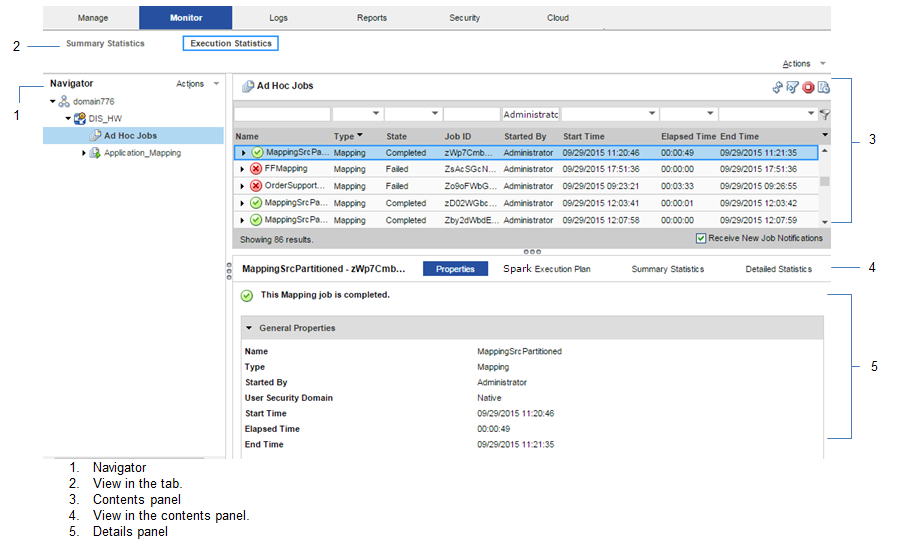
The following image shows the Monitor tab in the Administrator tool:
The Monitor tab has the following views:
Summary Statistics
Use the Summary Statistics view to view graphical summaries of object states and distribution across the Data Integration Services. You can also view graphs of the memory and CPU that the Data Integration Services used to run the objects.
Execution Statistics
Use the Execution Statistics view to monitor properties, run-time statistics, and run-time reports. In the Navigator, you can expand a Data Integration Service to monitor Ad Hoc Jobs or expand an application to monitor deployed mapping jobs or workflows
When you select Ad Hoc Jobs, deployed mapping jobs, or workflows from an application in the Navigator of the Execution Statistics view, a list of jobs appears in the contents panel. The contents panel displays jobs that are in the queued, running, completed, failed, aborted, and cancelled state. The Data Integration Service submits jobs in the queued state to the cluster when enough resources are available.
The contents panel groups related jobs based on the job type. You can expand a job type to view the related jobs under it.
Access the following views in the Execution Statistics view:
- Properties
The Properties view shows the general properties about the selected job such as name, job type, user who started the job, and start time of the job.
- Spark Execution Plan
When you view the Spark execution plan for a mapping, the Data Integration Service translates the mapping to a Scala program and an optional set of commands. The execution plan shows the commands and the Scala program code.
- Summary Statistics
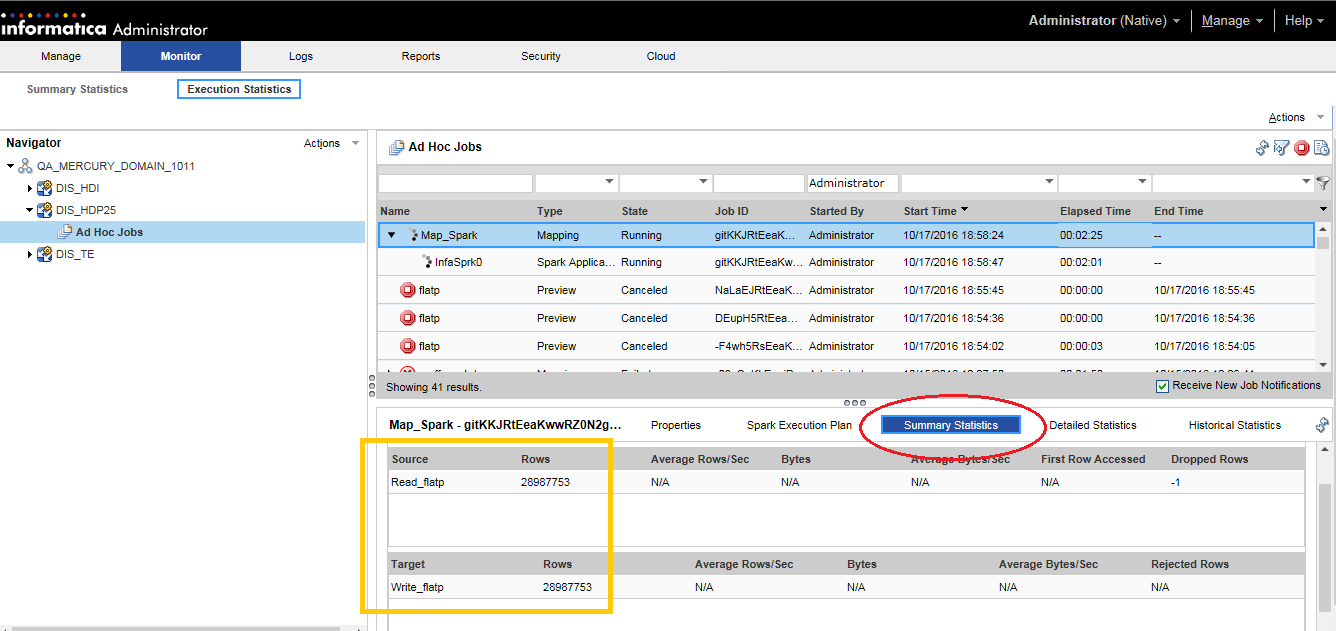
The Summary Statistics view appears in the details panel when you select a mapping job in the contents panel. The Summary Statistics view displays the following throughput statistics for the job:
- - Source. The name of the mapping source file.
- - Target name. The name of the target file.
- - Rows. The number of rows read for source and target.
The following image shows the Summary Statistics view in the details panel for a mapping run on the Spark engine:
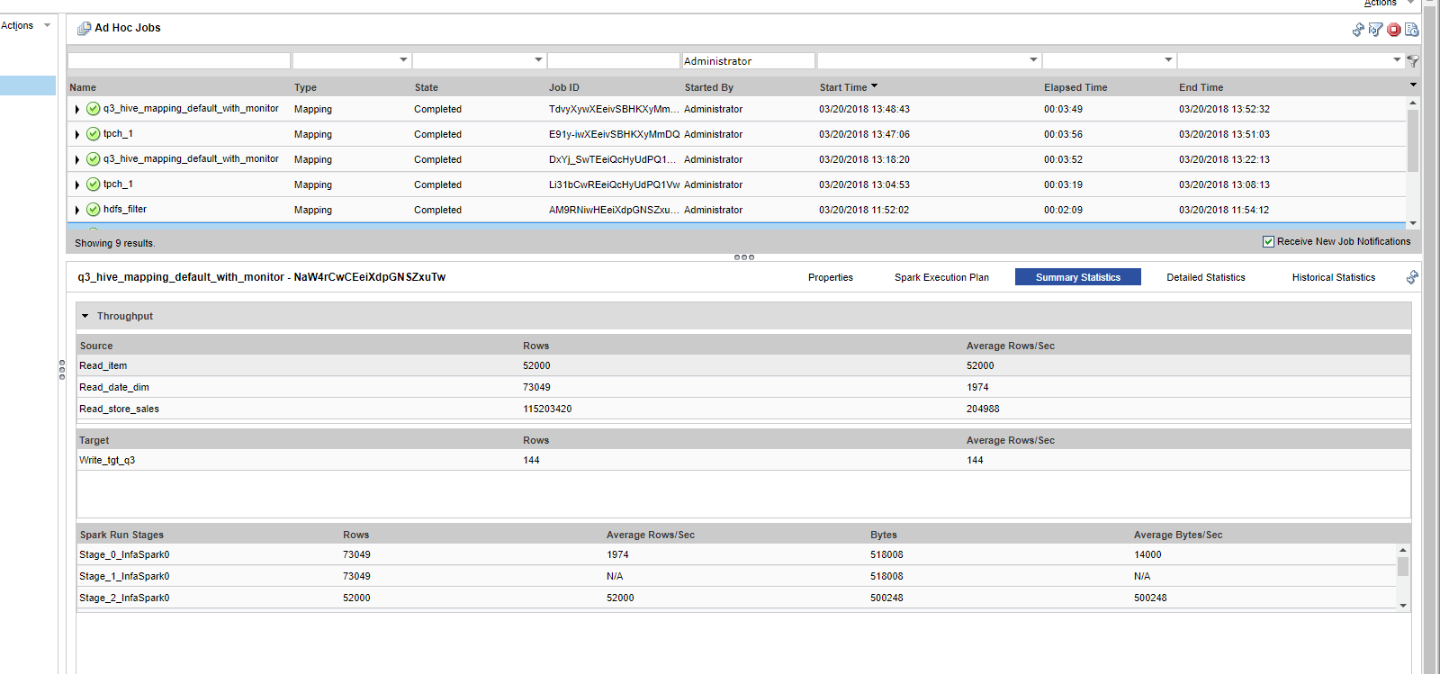
- You can also view the Spark run stages information in the details pane of the Summary Statistics view on the Execution Statistics Monitor tab. It appears as a list after the sources and targets.
- The Spark Run Stages displays the absolute counts and throughput of rows and bytes related to the Spark application stage statistics. Rows refer to the number of rows that the stage writes, and bytes refer to the bytes broadcasted in the stage.
The following image displays the Spark Run Stages:
For example, the Spark Run Stages column contains the Spark application staged information starting with stage_<ID>. In the example, Stage_0 shows the statistics related to the Spark run stage with ID=0 in the Spark application.
Consider when the Spark engine reads source data that includes a self-join with verbose data enabled. In this scenario, the optimized mapping from the Spark application does not contain any information on the second instance of the same source in the Spark engine logs.
Consider when you read data from the temporary table and the Hive query of the customized data object leads to the shuffling of the data. In this scenario, the filtered source statistics appear instead of reading from the temporary source table in the Spark engine log.
When you run a mapping with Spark monitoring enabled, performance varies based on the mapping complexity. It can take up to three times longer than usual processing time with monitoring enabled. By default, monitoring is disabled.
- Detailed Statistics
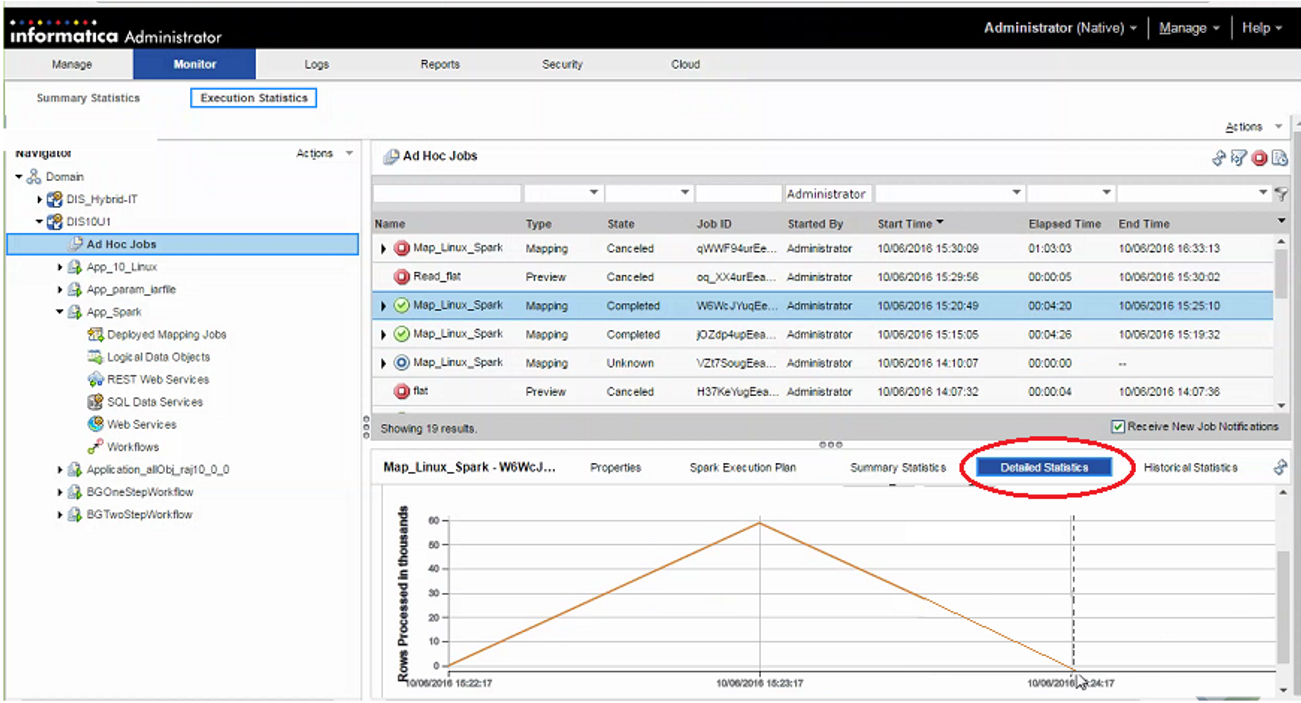
The Detailed Statistics view appears in the details panel when you select a mapping job in the contents panel. The Detailed Statistics view displays a graph of the row count for the job run.
The following image shows the Detailed Statistics view in the details panel for a mapping run on the Spark engine:
Viewing Hive Tasks
When you have a Hive source with a transactional table, you can view the Hive task associated with the Spark job.
When you run a mapping on Spark that launches Hive tasks, you can view the Hive query statistics in the session log and in the Administrator tool for monitoring along with the Spark application. For example, you can monitor information related to the Update Strategy transformation and SQL authorization associated to the mapping on Spark.
You can view the Summary Statistics for a Hive task in the Administrator tool. The Spark statistics continue to appear. When the Spark engine launches a Hive task, you can see Source Load Summary and Target Load summary including Spark data frame with Hive task statistics. Otherwise, when you have only a Spark task, the Source Load Summary and Target Load Summary do not appear in the session log.
Under Target Load Summary, all Hive instances will be prefixed with ‘Hive_Target_’. You can see same instance name in the Administrator tool.
Spark Engine Logs
The Spark engine logs appear in the LDTM log. The LDTM logs the results of the Spark engine execution plan run for the mapping. You can view the LDTM log from the Developer tool or the Monitoring tool for a mapping job.
The log for the Spark engine shows the step to translate the mapping to an internal format, steps to optimize the mapping, steps to render the mapping to Spark code, and the steps to submit the code to the Spark executor. The logs also show the Scala code that the Logical Data Translation Generator creates from the mapping logic.
When you run Sqoop mappings on the Spark engine, the Data Integration Service prints the Sqoop log events in the mapping log.
Viewing Spark Logs
You can view logs for a Spark mapping from the YARN web user interface.
1. In the YARN web user interface, click an application ID to view.
2. Click the application Details.
3. Click the Logs URL in the application details to view the logs for the application instance.
The log events appear in another browser window.
Troubleshooting Spark Engine Monitoring
- Do I need to configure a port for Spark Engine Monitoring?
Spark engine monitoring requires the cluster nodes to communicate with the Data Integration Service over a socket. The Data Integration Service picks the socket port randomly from the port range configured for the domain. The network administrators must ensure that the port range is accessible from the cluster nodes to the Data Integration Service. If the administrators cannot provide a port range access, you can configure the Data Integration Service to use a fixed port with the SparkMonitoringPort custom property. The network administrator must ensure that the configured port is accessible from the cluster nodes to the Data Integration Service.
