Field Match Analysis Example
You are a data steward at a retail bank. You receive a set of account records for the customers who opened bank accounts in the past seven days. You want to verify that the data set does not contain duplicate records. You design a mapping to search the records for duplicate data.
Create the Mapping
Create a mapping that looks for duplicate data in multiple fields.
The mapping performs the following tasks:
- •It reads a data source.
- •It adds a group key value and sequence identifier value to the source records.
- •It analyzes the field data in the records.
- •It writes the results to a data target.
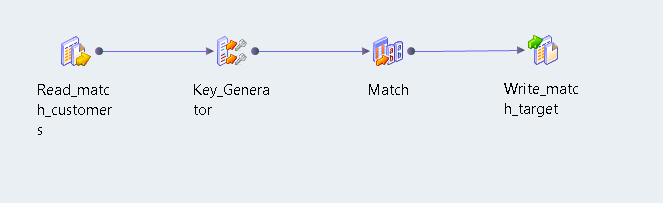
The following image shows the mapping in the Developer tool:
The mapping that you create contains the following objects:
Object Name | Description |
|---|
Read_Match_Customers | Data source. Contains the account holder details, including names, addresses, and account numbers. |
Key_Generator | Key Generator transformation. Adds group key values and sequence identifier values to the source data. |
Match | Match transformation. Analyzes the levels of duplication in the account data. |
Write_match_target | Data target. Contains the results of the field analysis. |
Input Data Sample
The data set contains the account number, name, address, and employer for each customer. You create a data source from the data set in the Model repository. You add the data source to the mapping.
The following data fragment shows a sample of the customer account data:
CustomerID | Lastname | City | State | ZIP |
|---|
15954467 | JONES | SCARSDALE | NY | 10583 |
10110907 | JONES | MINNEAPOLIS | MN | 55437 |
19131127 | JONES | INDIANAPOLIS | IN | 46240 |
10112097 | JONES | HOUSTON | TX | 77036 |
19133807 | JONES | PLANTATION | FL | 33324 |
10112447 | JONES | SCARSDALE | NY | 10583 |
15952487 | JONES | HOUSTON | TX | 77002 |
10112027 | JONES | OAKLAND | CA | 94623 |
Key Generator Transformation Configuration
When you configure the Key Generator transformation, connect the data source ports that you want to analyze. Specify the port that contains the group key data. If the records do not include a unique identifier, use the sequence ID port to add unique identifiers to the record.
When you specify the group key port, consider the following guidelines:
- •Select a port that contains values that repeat regularly in the port data. Preferably. select a port that creates groups that are similar in size.
- •Select a port that is not relevant to the duplicate analysis.
In the current example, select the City port as the group key. If an account name appears more than once in a city, the accounts might contain duplicate data. If an account name appears more than once in different cities, the accounts are unlikely to be duplicates.
Tip: Run a column profile on the data source before you select the group key port. The profile results can indicate the number of times each value appears on a port.
Match Transformation Configuration
Add a nonreusable Match transformation to the mapping to perform the field analysis.
Complete the following tasks to configure the Match transformation:
- 1. Select the type of match analysis to perform.
- 2. Connect the input ports to the transformation.
- 3. Configure strategies to compare the record data.
- 4. Select the type of match output data that the transformation creates.
- 5. Connect the output ports to a data target.
Select the Type of Match Operation
Use the options on the Match Type view to select the match operation. To compare the account data, configure the transformation to perform single-source field analysis.
Connect the Input Ports
Connect the customer account data ports to the Match transformation.
The Match transformation uses preset input ports to determine the order in which it processes the records. The transformation uses a sequence identifier to track the records from the input ports to the matched pairs or clusters that it writes as output. The transformation uses a group key to sort the records that it processes.
Connect the following preset ports on the Match transformation to the preset output ports on the Key Generator transformation:
Configure the Strategies for Field Analysis
Use the options on the Strategies view to configure the strategies. The strategies determine the types of analysis that the transformation performs on the record data.
Create the following strategies:
- •Create a strategy that uses the Edit Distance algorithm to analyze the customer identification numbers. Select the CustomerID_1 and CustomerID_2 ports.
- •Create a strategy that uses the Jaro Distance algorithm to analyze the surname data. Select the Lastname_1 and Lastname_2 ports.
Note: The Jaro Distance algorithm applies an additional penalty to similar strings that start with different characters. Therefore, the Jaro Distance algorithm can apply a high match score to PATTON and PATTEN but apply a lower match score to BAYLOR and TAYLOR.
- •Create a strategy that uses the Reverse Hamming Distance algorithm to analyze the ZIP code data. Select the Zip_1 and Zip_2 ports.
Select the Match Output Type
Use the options on the Match Output view to define the output format for the results of the match analysis.
The following image shows the Match Output view for single-source field analysis:
You configure the transformation to organize the output records in matched pairs. Because the transformation returns records in pairs, the results of the analysis do not include unique records.
Connect the Output Ports
Connect the Match transformation output ports to the data target in the mapping. Select the ports that contain the record data that you want to write to the data target.
The transformation includes preset ports that identify the records in each matched pair. The preset port names are RowId and RowId1. Each row ID value identifies a record in the output data.
The row ID values correspond to the ports that you select in a match strategy. When you configure a strategy, you select port names with the suffix _1 or _2. The RowId value identifies the record that contains a port with the suffix _1. The RowId1 value identifies the record that contains a port the suffix _2.
You can use other output ports to review the relationships between the records. The link port values and driver port values indicate the extent of the similarity between the records in each cluster.
In the current example, you connect all the ports to the data target. To view the output data on the ports, run the Data Viewer.
Run the Data Viewer
Run the Data Viewer to review the results of the match analysis. By default, the Data Viewer shows all the output ports on the Match transformation. When you run the mapping, you update the data target with the data from the output ports.
The following image shows the output data in the Data Viewer:
The Data Viewer verifies that the customer account data includes one or more duplicate records.
Consider the following data in the Data Viewer:
- •The transformation determines that the records for Augusta Chan and Carmen Chan might contain the same information because they contain the same surname and address data. When you review the records, you decide that the records are unique in the data set. However, you notice that the records share a common customer ID value. Because the customer ID column is a primary key in the data set, you contact the New York office. The New York office resolves the error.
- •The transformation determines that the records for Keith Anderson might contain the same information. When you review the records, you verify that the two records represent the same account. However, you notice that the records have different customer ID values. Because a customer account must have a single ID value, you contact the San Antonio office. The San Antonio office resolves the error.
Conclusion
The results of the match analysis indicate that the customer account data set includes at least one pair of duplicate records. You contact the local branch for the accounts that you need to verify. You verify that the other records in the data set uniquely identify a customer account.