The Diagram View
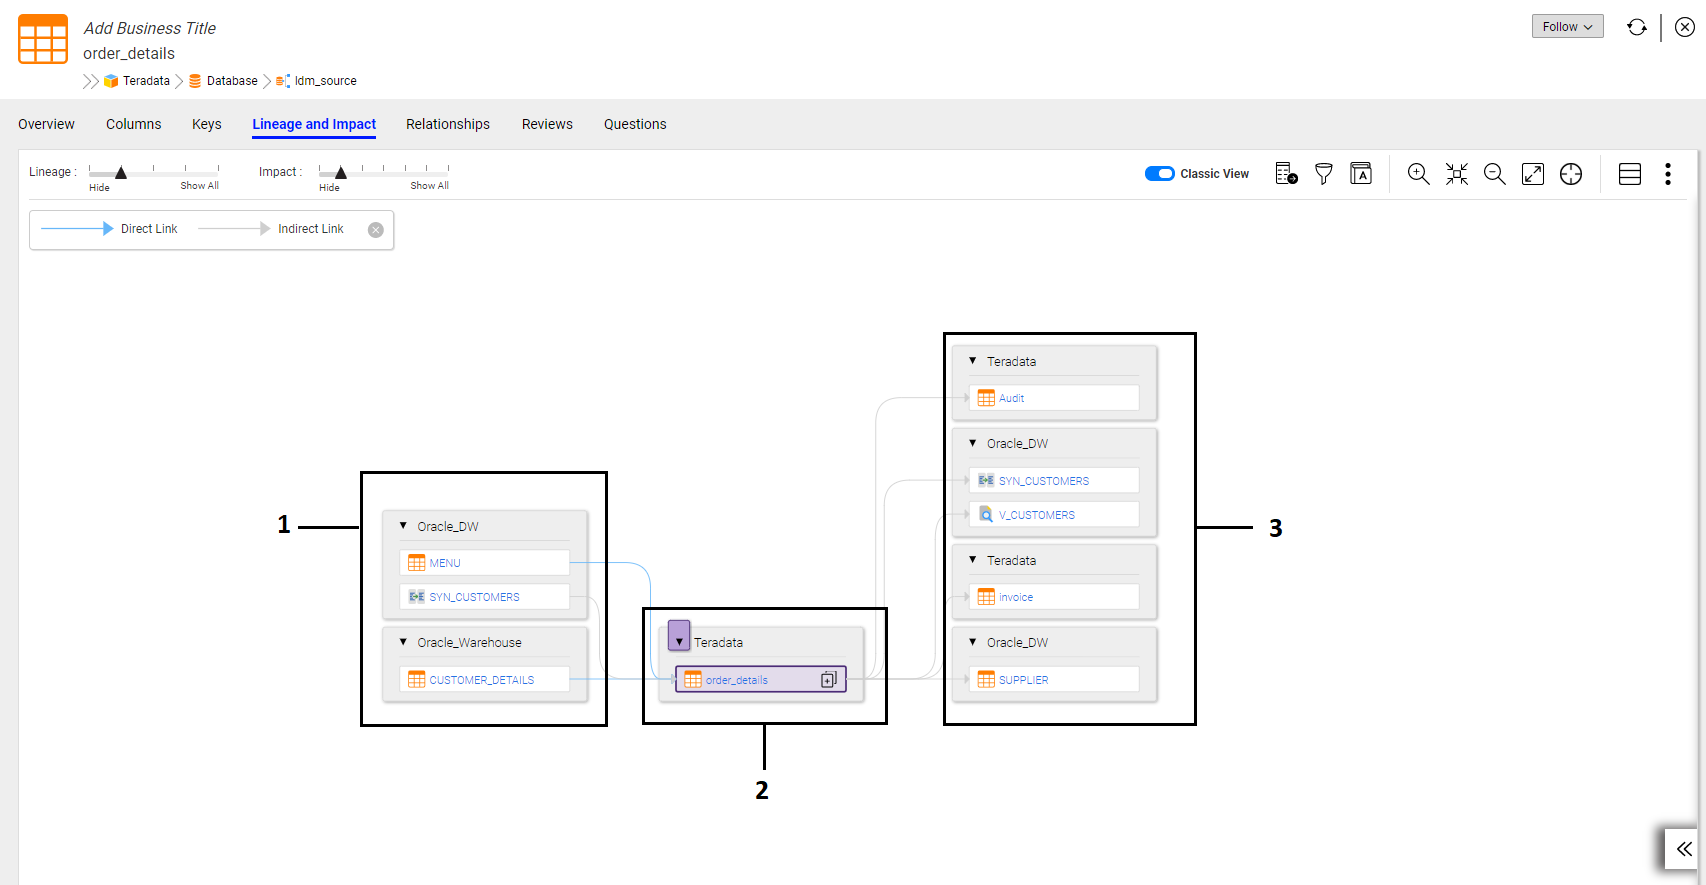
When you open the Lineage and Impact tab for an asset, Enterprise Data Catalog displays the diagram view by default. The diagram view contains the lineage and impact diagram for the asset.
The asset from which you open the Lineage and Impact tab is called the seed asset. The diagram view displays the origins of the data, the seed asset, and the destinations for the data. The seed asset appears within its own frame even if there are other assets in the data flow that are within the same resource.
Intermediate assets are the assets between an origin and the seed asset and between the seed asset and a destination. All intermediate assets are hidden by default. Hiding the intermediate assets decreases the time it takes to display the diagram and simplifies the view.
The assets shown in the diagram vary based on the seed asset type. For example, if the seed asset is a relational table, the lineage and impact diagram shows other tables and data structures that impact and are impacted by the table. The lineage and impact diagram does not display the columns or fields within the other tables and data structures.
The following image shows the default diagram view for a sample asset:

- 1. Origins
- 2. Seed asset
- 3. Destinations
The arrow between adjacent assets is called a link. A diagram can contain the following types of links:
- •A direct link (
 ) means that there are no other assets between the two assets. Direct links are marked with solid arrows.
 - •An indirect link (
 ) means that the link contains intermediate assets. Indirect links are marked with dashed arrows.
 To view intermediate assets, use the Lineage and Impact sliders at the top of the diagram or click the plus sign (+) that appears when you hover over the link.
To get information about any asset in the diagram, hover over the asset name. When you hover over the name, Enterprise Data Catalog displays a tooltip that contains information about the asset such as asset type, resource name, resource type, and associated business term. To open the asset, click the asset name. You can use the Lineage and Impact sliders to display the intermediate assets that are upstream and downstream of the seed asset.
The following image shows the lineage and impact sliders:

You can perform the following tasks in the diagram view:
- •Display the child assets for the seed asset.
- •Display the intermediate assets that are upstream and downstream of the seed asset.
- •Display transformation logic in the diagram view.
- •Display assets within a link.
- •Display associated business terms in the diagram view.
- •Customize the view to zoom in and out of the diagram, fit the diagram to the window, pan the diagram, and show or hide the legend.
- •Export the diagram and print the diagram.
- •Filter the diagram.
 ) means that there are no other assets between the two assets. Direct links are marked with solid arrows.
 ) means that the link contains intermediate assets. Indirect links are marked with dashed arrows.
