Column and Field Assets
You can view column and field assets such as relational table columns, CSV fields, and business intelligence report fields in Enterprise Data Catalog. You can view details about column and field assets and curate the data domains for column and field assets in the Overview tab.
The following types of assets are examples of column and field assets:
- •Business intelligence report columns and fields
- •Columns in relational tables, views, and synonyms
- •Fields in CSV, JSON, and XML files
- •Fields in Salesforce objects
- •Hive columns
The Overview tab shows different details for different types of column and field assets. For column and field assets in resources that support profiling, the Overview tab shows the description, associated business terms, system attributes, data domains, and profile results. For other column and field assets, the Overview tab shows the description, system attributes, people associated with the asset, and business terms.
For column and field assets in resources that support profiling, you can accept or reject the data domains that are inferred for the asset. You can also assign one or more data domains to the asset. If an appropriate data domain does not exist, you can create one.
Curation is the process of accepting and rejecting data domains for assets. You can curate data domain results for a column or field asset from the Overview tab.
The following image shows the Overview tab for a relational column that has profile results:
- 1. Profile results for the column.
- 2. Curate data domains for the column.
Column and Field Overview
The Overview tab for a column or field asset displays details such as the description of the asset, data domains, system attributes, associated business terms, and profile results. When the asset has profile results, the Overview tab displays the value frequency, patterns, and inferred data types for the column or field values.
Enterprise Data Catalog displays the following details for a column and field assets:
- Description
- The Description section displays the column or field asset description. Use the Edit Properties icon (
 ) to edit or add description for the asset. You can enter rich text as the description for the asset. Use the text formatting options to format the rich text. To add more descriptive context to the asset, you can also add multiple sections under the Description section. For example, you create and configure a rich text type custom attribute called Additional Description for the column or field asset in the Catalog Administrator. Enterprise Data Catalog displays the custom attribute as an another section under the Description section in the Overview tab.
 - People
- The People section displays the users associated with the column or field asset. The section by default displays the data owner and data steward fields. Use the Edit Properties icon () to add or change the users associated with the glossary. The additional user fields that you see in the section appear after the catalog administrator creates and configures a custom attribute of User data type for a column or field asset in the Catalog Administrator.
- Business Terms
- The Related Business Terms section displays custom attributes of data types, such as Business Term, Glossary, Axon Glossary. The section displays related terms after the catalog administrator creates and configures the custom attribute for a column or field asset in the Catalog Administrator. You can associate multiple business terms as custom attribute values with the asset. Use the Edit Properties () to add, remove, or change the business term values.
- Classifications
- The Classifications section displays all the asset classifications based on custom attributes of reference data types. The custom attributes of a reference data type depend on how the custom attributes are defined in Informatica Business Glossary or Informatica Axon. For example, if you have a column or field containing the sales details belonging to a particular region, you might want to classify the assets based that region. To classify the asset, you can assign a custom attribute of reference data type called APAC to the asset. Use the Edit Properties () to add, remove, or change the business classification values.
- Custom Attributes
- The properties that the Custom Attributes section displays depends upon the different types of custom attributes the catalog administrator creates and configures for a column or field asset in the Catalog Administrator. The section displays custom attributes of data types, such as the date, string, boolean, decimal, integer, and URL. Use the Edit Properties icon () to add or change values of the properties in the section.
- System Attributes
- The Overview tab displays the System Attributes section for all column and field assets. The system attributes that are shown by default vary based on the parent resource type. For example, the default system attributes for an Oracle Business Intelligence Enterprise Edition report field include the data set UUID, native ID, native type, position, and resource name.
- You can change the system attributes that are displayed in the Overview tab when you configure search filters in the Application Configuration dialog box.
- Value Frequency
- You can view the value frequency for view column, table column, CSV field, XML file field, and JSON file data assets in the Overview tab. In the value frequency section, you can view the distribution of values across the data asset, the maximum and minimum values in the data asset, the distribution of distinct values in the data asset, and a list of values and their frequency in a tabular format.
The value distribution chart for a data asset appears by default after you run the similarity profile and value frequency on the data asset in the Catalog Administrator.
The following image displays the value frequency section in the Overview tab:
The value distribution for the first 1000 rows in the data asset appears as a horizontal bar chart. The horizontal bar chart displays the distribution of NULL values, distinct values, and non-distinct values in different colors. When you move the pointer over the chart, the number of rows and the percentage of values pertaining to the data point appears in a data label. A data label is similar to a tool tip and it displays the data that pertains to the data point in the chart over which you hover the pointer.
After you run the value frequency for a data asset, you can view the following information about the data asset in the value frequency section:
- - Max. Displays the maximum value in the data asset. After you click Max, the maximum value along with the frequency and percentage appears in a tabular format below the value frequency graph.
- - Min. Displays the minimum value in the data asset. After you click Min, the minimum value and the next 19 values in the data asset along with the frequency and percentage appear in a tabular format below the value frequency graph.
- - Value frequency graph. The graph displays the distribution of distinct values in the data asset as vertical bars in the column chart. The X-axis in the column chart represents values, and the Y-axis represents the frequency of values. The values are arranged from maximum to minimum number of occurrences in the chart. The chart displays the first 1000 distinct values in the data asset and has a slider. The values within the slider appear in a tabular format below the value frequency graph along with the frequency and percentage of the value.
- - Values in tabular format. The values along with the frequency and percentage appear in a tabular format. The values within the slider appear in the table or after you click the Max or Min value. At a time, you can view only 20 values in the table.
Note: You need specific permissions and privileges to view the value frequency section. Contact the catalog administrator for more information.
- Similar Columns
- The Similar Columns section displays all the columns that are similar to the column you are viewing. Enterprise Data Catalog discovers similar columns based on column names, column patterns, and unique values. Click View All icon to view all the similar columns.
You can view the following details in the Similar Columns section:
- - Column Name. Displays the column or field name. To view the column or field asset details, click the column name. The column asset details appear in the Overview tab.
- - Business Term. Displays the associated business term.
- - Data Domain. Displays the inferred data domains for the column and the percentage of rows that conform to the data domain. The inferred data domains appear in orange color and the curated data domains appear in green color.
- - Confidence %. Displays the score and the parameters based on which the score is calculated. The confidence score is calculated by an internal algorithm based on the discovered similar column names, similar column patterns, and similar unique values for the column that you are viewing. You can view the Data, Distinct Values, Name, and Pattern parameters.
- Data Domain
- The Data Domain section appears for column and field assets that support profiling, such as relational table and view columns, fields in CSV, JSON, and XML files, and fields in Salesforce objects.
- A data domain is a predefined or user-defined Model repository object that enables you to discover the functional meaning of column data or column names in a data source. Examples of data domains include Social Security number, account status, IP address, and UPC code.
The inferred data domains appear in orange boxes with the inference percentage. For example,

. You can accept or reject the inferred domains.
The data domains that you accept are assigned to the asset. The assigned data domains appear in green boxes. For example,

. You can reject any assigned data domain, if required.
You can create a smart data domain if you want to discover assets that have similar columns or fields. For example, your organization uses a unique pattern for employee ID and you want to discover all the assets that contain the employee ID pattern. To accomplish this task, you can either create a data domain in Catalog Administrator or create an on-the-fly data domain, also called smart data domain in Enterprise Data Catalog.
You can create a smart data domain instantly with the existing pattern of the column or field. This data domain does not contain any rule. To use the column or field pattern as a data domain, click the
icon to create a smart data domain. After you create the data domain, run the Informatica Similarity Discovery and DataDomainPropagation scanner in Catalog Administrator to propagate and discover assets that contain a similar pattern. You can view smart data domains in Catalog Administrator. To convert an smart data domain to a rule-based data domain, add one or more rules, conformance values, and proximity data domains.
- Pattern
In the Pattern section, you can view the data patterns for the column or field values along with the percentage and frequency. Each inferred pattern appears a horizontal bar chart along with the pattern format, number of rows, and percentage of rows.
- Inferred Data Types
- In the Inferred data types section, you can view all of the inferred data types for the column or field. Each inferred data type appears as a horizontal bar chart along with the data type, number of rows, and percentage of rows.
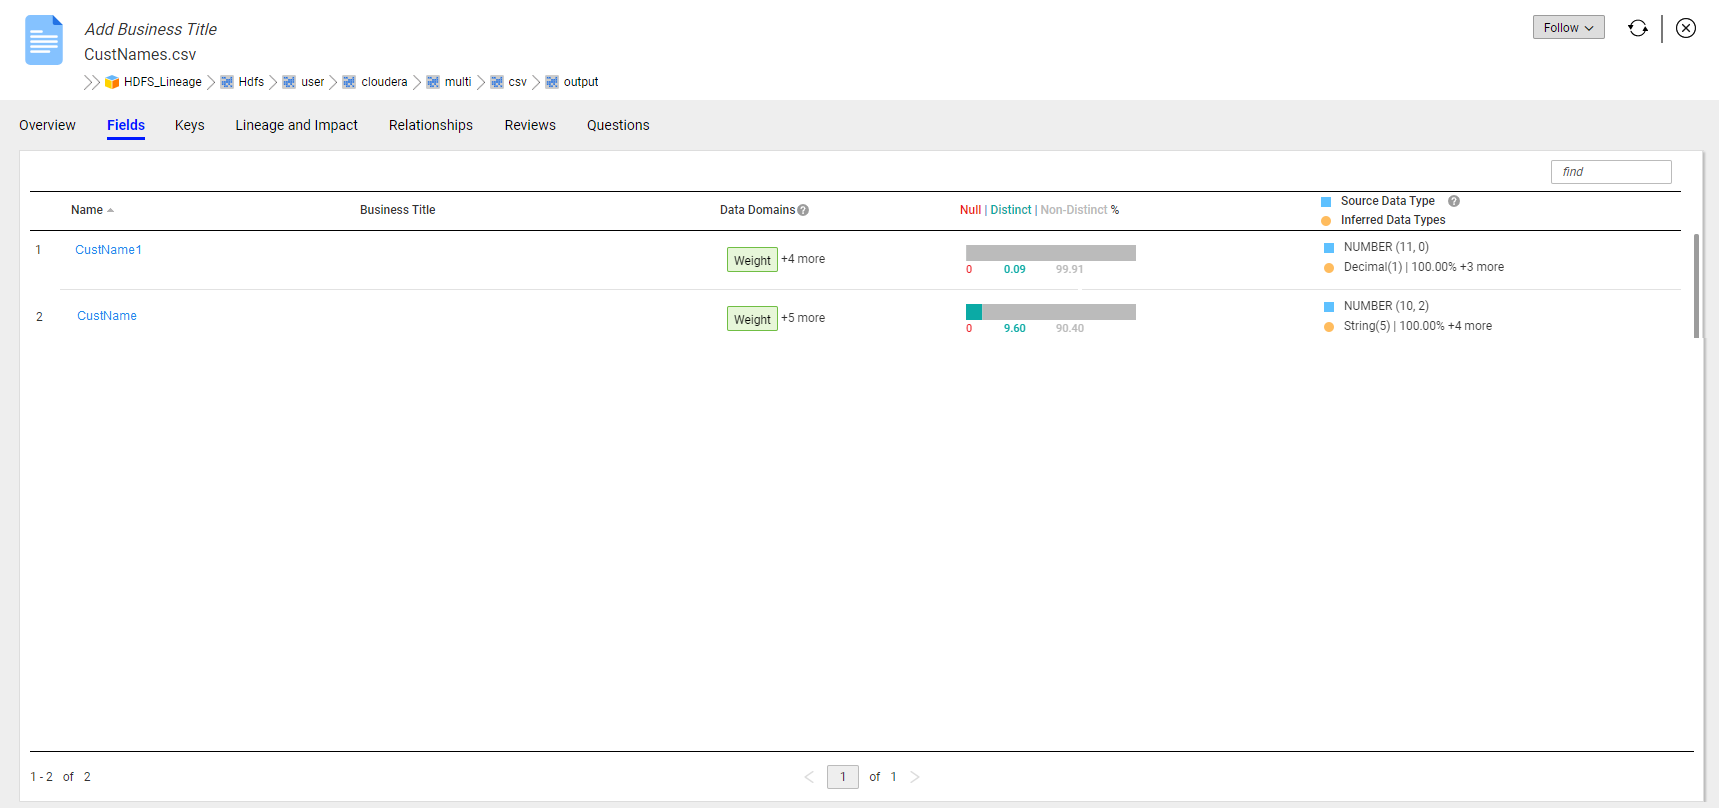
Viewing the Field Details
The Fields tab displays all the fields for assets such as delimited files and JSON files.
On the Fields tab, you can view the following details for each field in the asset:
- Name
- Displays field names. By default, the fields list appears in the ascending order based on the field position in the data source. To sort fields in ascending or descending order based on the source position, click the arrow (
 ) icon. To sort fields in alphabetical order by name, click the Name heading on the Fields tab. To sort fields in reverse alphabetical order, click the field heading again. To view the field asset details on the Overview tab, click the field name link.
 Note: You can sort delimited fields by field position.
- Business Title
- Displays the business title associated with the field. You can also view the recommended business terms if you want to associate a business term as a business title with the field.
- Data domains
- Displays the data domains associated with the field. Hover the mouse over a data domain to view the Name Match, Data Match, Proximity Match, System Suggested, and Assigned by details. The inferred data domains appear in orange color and the curated data domains appear in green color. The Name Match displays Yes when the field name matches with the data domain. The Proximity Match displays a score that is a ratio of the number of proximal data domains discovered in the data asset to the number of configured proximal data domains for an inferred data domain.
- Null Distinct Non-Distinct %
- Displays the percentage of null, distinct, and non-distinct values in a field. Hover the mouse over the horizontal bar chart to view the number rows that contain null, distinct, and non-distinct values.
- Source Data Type Inferred Data Types
- Displays the documented data type and inferred data types of the field. Hover the mouse to view the list of documented data type and inferred data types with percentages.
The following image displays the sample Fields tab:
Creating a Smart Data Domain
In Enterprise Data Catalog, if you identify a column or field asset as a potential data domain, you can create a smart data domain instantly. The data domain that you create is stored in the Model repository.
To create a data domain in Enterprise Data Catalog, you must have the Catalog Management: Domain Curation privilege.
1. In the Search Results screen, identify the column or field asset for which you want to assign the data domain.
2. Click the asset.
The asset appears in the Overview tab.
3. In the Data Domain section, click the icon. The Edit Data Domains dialog box appears.
4. Enter a name for the data domain. Click Add.
5. In the New Data Domain dialog box, you can enter the following details:
- - Optionally, enter a description for the data domain.
- - Optionally, you can select a data domain group to which you want to assign the data domain.
6. Click OK.
In the Edit Data Domains dialog box, the data domain appears in the Accepted & Inferred Data Domains list. The Assigned By column lists your user name as the person who assigned the data domain to the asset.
7. Click OK.
Data Domain Curation for Columns and Fields
Curation is a process to accept or reject data domains for an asset. You can curate the data domains for column and field assets.
In Catalog Administrator, you can run data domain discovery on resources. In Enterprise Data Catalog, you can view the inferred data domains for column and field assets. When you configure the Auto accept if more than conformance criteria option for a resource, Enterprise Data Catalog accepts the data domain automatically when the data domain match exceeds the configured value. Data domain inference is also based on the data domains that are assigned to similar assets in Enterprise Data Catalog. When you create a data domain in Enterprise Data Catalog and assign it to a column or field, Enterprise Data Catalog infers the data domain for similar assets.
You can perform the following curation tasks for a column or field in the Overview tab:
- •Accept or reject the inferred data domains for the asset.
- •Assign a data domain to the asset. If an appropriate data domain does not exist, you can create one.
- •Reject an assigned data domain.
- •Accept a rejected data domain.
Note: If you accept or reject an inferred data domain for an asset, you cannot set the data domain back to the inferred status.
Viewing and Curating the Data Domains for Tabular, Column, and Field Asset
You can assign a data domain to a column or field even though the data domain was not inferred for the asset. You can also accept a previously rejected data domain or reject an assigned data domain.
1. In the Enterprise Data Catalog home page, type a table name that contains columns or fields assets, and click the search icon.
2. In the Search Results page, click the table asset.
3. In the Overview tab for the asset, you can view the inferred data domains in the Sample Columns section. The Data Domain column displays the data domain name, if column name matches the data domain, and if there is a proximity match in the asset.
4. Click a column or field in the table asset.
The column or field asset appears in an Overview tab.
5. In the Overview tab, you can view asset details, such as Description, People, Business Terms, Business Classifications, Custom Attributes, System Attributes, Value Frequency, Similar Columns, Pattern, Inferred Data Types, and Data Domain.
6. Scroll to the Similar Columns section to view all the columns that are similar to the column you are viewing.
The Data Domain column in the Similar Columns section displays the inferred data domains for the column and the percentage of rows that conform to the data domain.
7. Scroll to the Data Domain section to view the data domains that are inferred for the asset from profile results or from similar columns. This section appears only for column and field assets in resources that support profiling such as relational table and view columns, fields in CSV, JSON, and XML files, and fields in Salesforce objects.
8. Data domains that appear in an orange box with the inference percentage are inferred data domains. For example, . You can perform the following tasks on an inferred data domain:
- - Click the
 icon to accept the data domain. After you accept the data domain, the box turns green. The data domains that are auto-accepted appear in a green box. For example, .
 - - Click the
 icon to reject the data domain. After you reject a data domain, the data domain no longer appears in the Data Domain section for the asset.
9. In the Data Domain section, click the icon to view the list of data domains that are assigned or inferred for the asset and the list of data domains that are rejected for the asset. 10. To assign a data domain to the asset, perform one of the following tasks:
- - If the data domain appears in the Accepted & Inferred Data Domains or Rejected Data Domains list, click the icon.
- - If the data domain exists in the Model repository but does not appear in the lists, then you can create a data domain on-the-fly. The data domain is called a smart data domain.
The data domain then appears the Accepted & Inferred Data Domains list, and the Assigned By column lists your user name as the person who assigned the data domain to the asset.
11. To reject an assigned or inferred data domain, click the icon for the data domain in the Accepted & Inferred Data Domains list. The data domain moves to the Rejected Data Domains list, and the Assigned By column lists your user name as the person who rejected the data domain for the asset.
12. To accept a data domain and reject all the assigned, inferred, or accepted data domains, perform the following tasks:
- a. In the Accepted & Inferred Data Domains list, select a data domain that you want to accept.
- b. Click the
 icon, and then click the Accept this, reject the rest option.
13. Click OK.

