Dashboard Overview
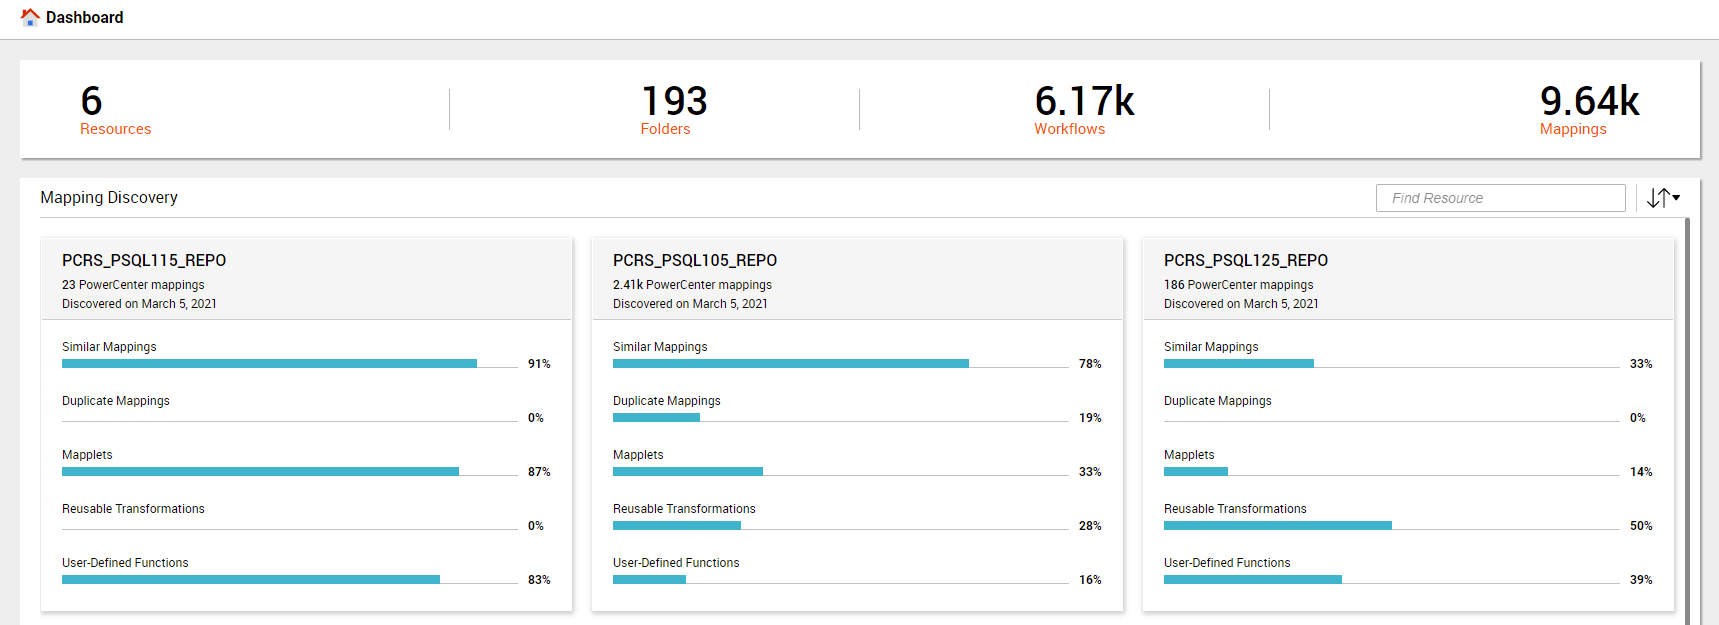
Use the dashboard to view the statistical summary of mappings that exist in PowerCenter resources. You can view the key metrics such as the number of resources with mappings, folders where the mappings exist, number of workflows defined for the mappings, and total number of mappings that were part of the analysis.
The dashboard contains the Mapping Discovery section. The section displays the mapping statistics for each resource in different subsections.
The mapping statistics include the name of the resource, total number of mappings that were discovered, and date and year when the mappings were discovered. The resource subsection also displays information such as the percentage of similar mappings, duplicate mappings, and mappings with mapplets, reusable transformations, and user-defined functions.
To view details of each resource, click the resource subsection to open the resource on the resource mapping discovery page.
You can sort the Mapping Discovery section based on the resource name and discovery date. To find a particular resource, you can search for the resource by name in the search field.
The following image displays a sample mapping discovery dashboard:
Note: The mapping discovery dashboard displays the total number of mappings available in the PowerCenter repository. The asset overview page for the PowerCenter resource displays the number of mappings that are associated with at least one workflow.
Resource Mapping Discovery
Use the resource mapping discovery page to view the analytical information of a particular mapping resource.
The page displays general information such as the name of the resource, the total number of mappings that the resource contains, and the date when the mappings were discovered. The page also displays the Mapping Discovery section. By default, the Mapping Discovery section displays the Similar Mappings tab. The section contains other mapping discovery tabs such as duplicate mappings, mapplets, reusable transformations, and user-defined functions.
Each mapping discovery tab displays mapping groups or candidates and a table that contains a list of mappings within the selected mapping group or candidate.
You can view the following details in the mapping discovery tabs:
- Similar Mappings
- Use the similar mappings tab to view a summary of the similarity analysis of all the mappings in the resource. The tab categorizes mappings into different groups based on the similar mapping structure. Each group consists of mappings that include similar data integration patterns and identical sources, targets, and transformation types.
- Duplicate Mappings
- Use the duplicate mappings tab to view a summary of the duplicate mappings analysis of all the mappings in the resource. The tab categorizes mappings into different groups based on the identical mapping structure. Each group consists of mappings that include identical transformation objects, data integration patterns, and sources and targets.
- Mapplets
- Use the mapplets tab to view a summary of the mapplet candidate analysis in the resource. A mapplet is a reusable object that you create in the Mapplet Designer. It contains a set of transformations and lets you reuse the transformation logic in multiple mappings. Data Flow Analytics discovers identical repeated mapping transformation sequences that you can use to create reusable mapplets. The tab categorizes identical repeated mapping transformation sequences as mapplet candidates. Each candidate consists of identical mapplet instances.
- Reusable Transformations
- Use the reusable transformations tab to view a summary of the reusable transformation candidate analysis in the resource. The tab categorizes the reusable transformations into different candidates based on an identical transformation that you can reuse in other mappings. Each candidate consists of identical reusable transformations.
- User-defined Functions
- Use the user-defined functions tab to view a summary of the user-defined function candidates analysis in the resource. The tab categorizes expressions in transformation fields into different candidates if the expressions are found in five or more transformation fields. Each candidate consists of identical expression templates. Data Flow Analytics discovers complex expressions with similar syntax within the expression transformation fields. A complex expression includes at least 24 leaf nodes in the expression parse tree. You can use the expressions as user-defined functions.
Similar Mappings
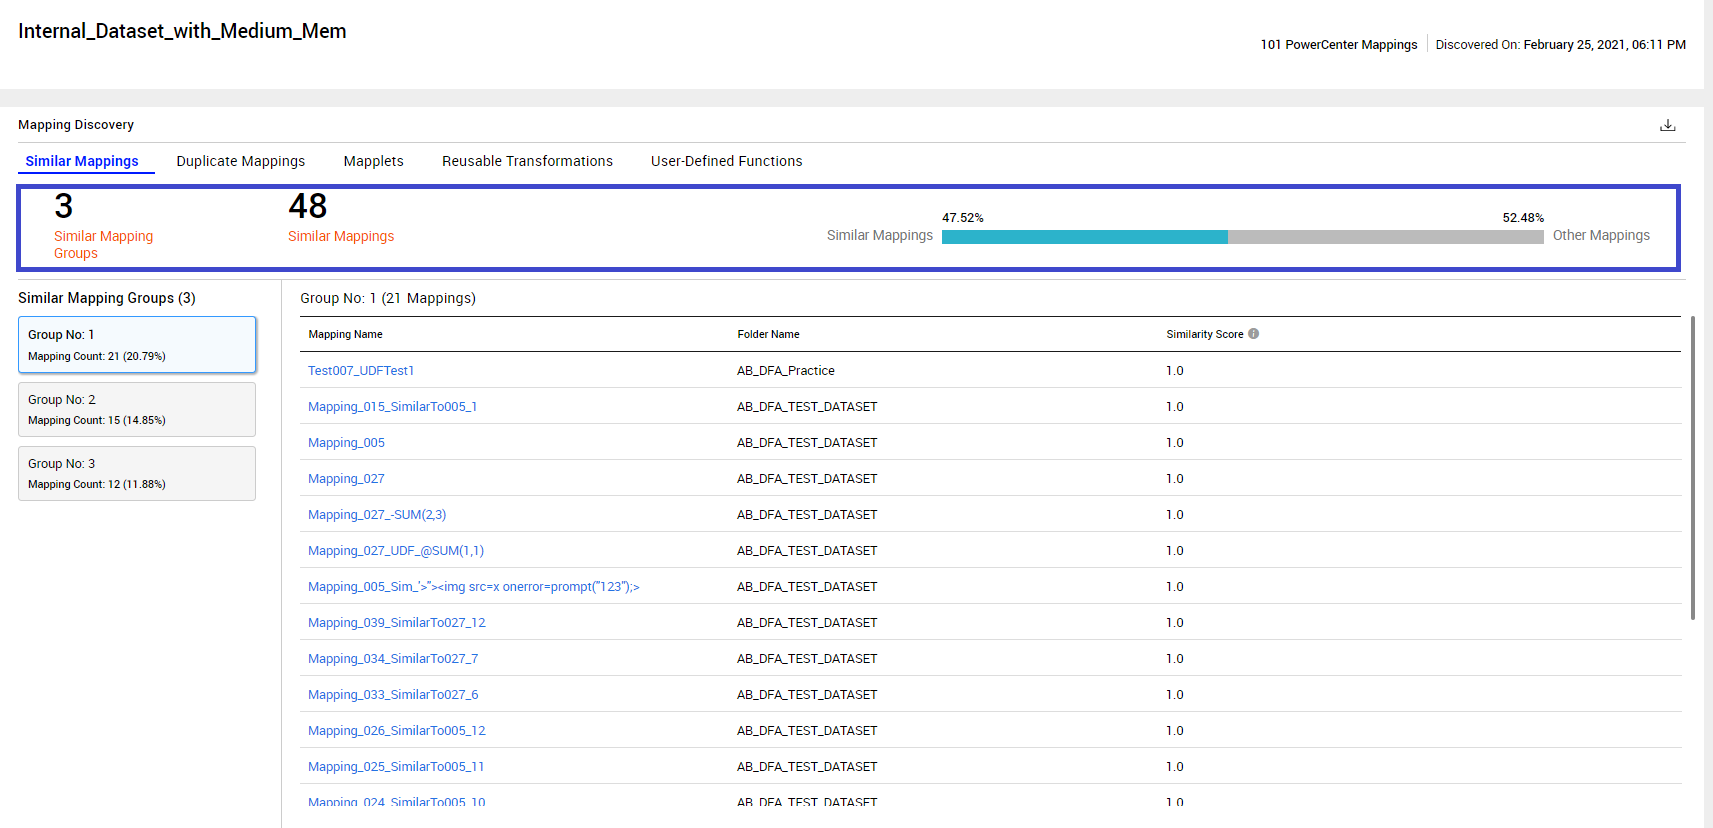
The Similar Mappings tab displays the analytical summary of the similar mappings in the resource.
The following image displays a sample
Similar Mappings tab with the key metrics highlighted:
Similar Mappings Key Metrics
You can view the following key metrics on the Similar Mappings section:
- Similar Mapping Groups
- Displays the number of similar mapping groups in the resource.
- Similar Mappings
- Displays the number of similar mappings in the resource.
- Similar Mappings Percentage
- Displays the percentage of similar mappings to the total number of mappings in the resource.
Similar Mapping Groups
Data Flow Analytics categorizes mappings into different groups based on similar data integration patterns, identical source and target types, and transformation types. For example, consider that a resource R1 consists of ten mappings. Out of the ten mappings, three mappings in the resource have DB2 as the source and Oracle as the target type, and other seven mappings include Teradata as the source and Oracle as the target type. The first three mappings are grouped into Group 1 and the other seven mappings are grouped into Group 2.
The Similar Mapping Groups section displays a list of mapping groups. Each mapping group displays the count and percentage of mappings that belong to that group. Based on the number of mappings in each group, the section displays top 30 mapping groups and each group includes at least ten mappings.
The section also contains a table that displays details of the mappings in that group. The details include the folder name where the mapping exists and the similarity score. The similarity score provides a measure of how similar the mapping is to other mappings in the group.
If you want to view the details of a particular mapping, click the mapping name from the table. To view the graphical representation of the mapping, click the View Diagram button.
Duplicate Mappings
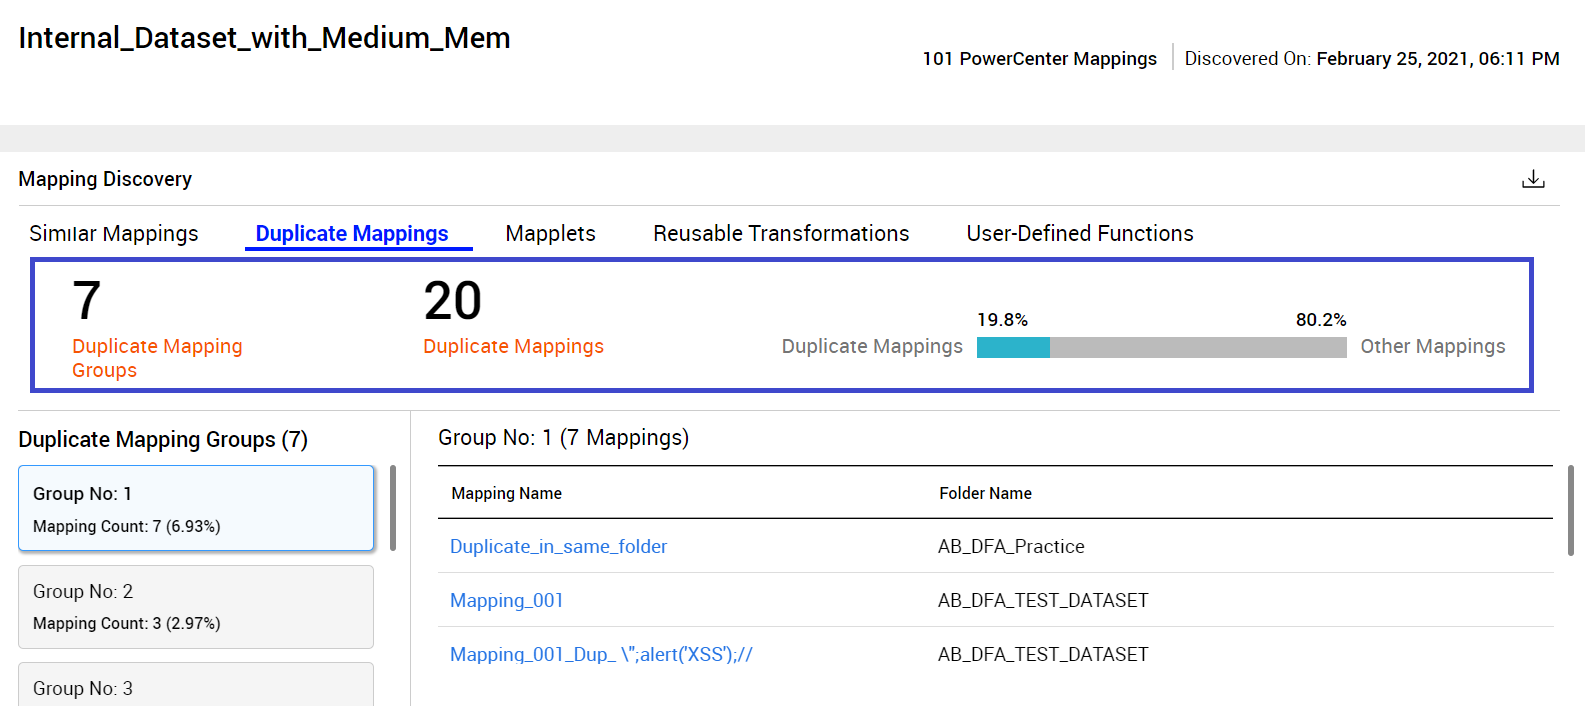
The Duplicate Mappings tab displays the analytical summary of the duplicate mappings in the resource.
The following image displays a sample
Duplicate Mappings tab with the key metrics highlighted:
Duplicate Mappings Key Metrics
You can view the following key metrics on the Duplicate Mappings tab:
- Duplicate Mapping Groups
- Displays the number of duplicate mapping groups in the resource.
- Duplicate Mappings
- Displays the number of duplicate mappings in the resource.
- Duplicate Mappings Percentage
- Displays the percentage of duplicate mappings to the total number of mappings in the resource.
Duplicate Mapping Groups
Data Flow Analytics categorizes mappings into different groups based on identical sources, targets, transformations, and field links that the mappings include.
The Duplicate Mapping Groups section displays the list of mapping groups. Each mapping group displays the count and percentage of mappings that belong to that group. The section also contains a table that displays the folder names where the mappings exist.
If you want to view the details of a particular mapping, click the mapping name from the table. To view the graphical representation of the mapping, you can click the View Diagram button.
Mapplets
The Mapplets tab provides a summary of the mapplet candidates analysis of all mappings in the resource.
The following image displays a sample
Mapplets tab with the key metrics highlighted:
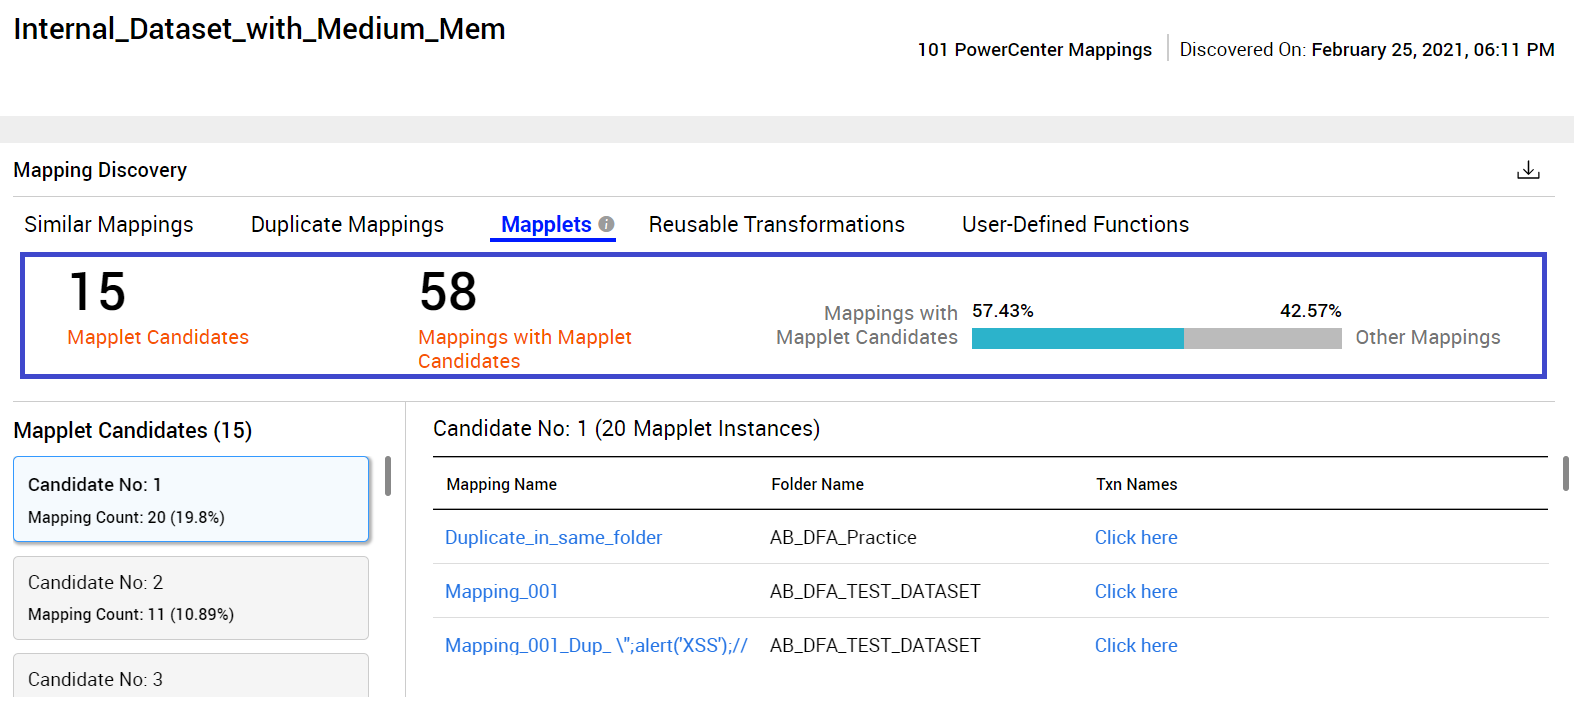
Note: In Data Flow Analytics, the abbreviation Txn is used to denote transformation.
Mapplets Key Metrics
You can view the following key metrics on the Mapplets tab:
- Mapplet Candidates
- Displays the number of mapplet candidates in the resource.
- Mappings with Mapplet Candidates
- Displays the number of mappings that include mapplet candidates in the resource.
- Mappings with Mapplet Candidates Percentage
- Displays the percentage of mappings with mapplet candidates to the total number of mappings in the resource.
Mapplet Candidates
Data Flow Analytics categorizes identical repeated mapping transformation sequences into mapplet candidates. Each candidate consists of identical mapplet instances.
The Mapplet Candidates section displays the list of mapplet candidates in the resource. Each mapplet candidate displays the count and percentage of mappings that contain a particular mapplet candidate. The section also contains a table that displays the folder names where the mappings exist and transformations that are included in the mapplet instances.
If you want to view the details of a particular mapping, click the mapping name from the table. To view the transformation name and type of transformation that is used in the mapplet instance, click the link under the Txn Names column. To view the graphical representation of the mapping, you can click the View Diagram button. In the diagram, the mapplet instances or transformation sequences are highlighted.
Reusable Transformations
The Reusable Transformations tab provides a summary of the reusable transformation candidates analysis of all mappings in the resource.
The following image displays a sample
Reusable Transformations tab with the key metrics highlighted:

Reusable Transformations Key Metrics
You can view the following key metrics on the Reusable Transformations tab:
- Reusable Transformation Candidates
- Displays the number of reusable transformation candidates in the resource.
- Mappings with Reusable Transformations
- Displays the number of mappings that include reusable transformation candidates in the resource.
- Mappings with Reusable Transformations Percentage
- Displays the percentage of mappings that contain reusable transformation candidates to the total number of mappings in the resource.
Reusable Transformations Candidates
Data Flow Analytics categorizes the reusable transformations into different candidates based on an identical transformation that can be reused in other mappings.
The Reusable Txn Candidates section displays the list of reusable transformation candidates. Each reusable transformation candidate displays the count of mappings that contain a particular candidate and the type of transformation. The section also contains a table that displays the folder names where the mappings exist and names of the transformations that you can reuse.
If you want to view the details of a particular mapping, click the mapping name from the table. To view the graphical representation of the mapping, you can click the View Diagram button. In the diagram, the re-usable transformations are highlighted.
User-Defined Functions
The User-Defined Functions tab provides a summary of the user-defined function candidates analysis of all mappings in the resource.
The following image displays a sample
User-Defined Functions tab with the key metrics highlighted:

User-Defined Functions Key Metrics
You can view the following key metrics on the User-Defined Functions tab:
- User Defined Functions (UDF) Candidates
- Displays the number of UDF candidates in the resource.
- Mappings with UDFs
- Displays the number of mappings that include UDF candidates in the resource.
- Mappings with UDFs Percentage
- Displays the percentage of mappings that include UDF candidates to the total number of mappings in the resource.
User-Defined Functions Candidates
Data Flow Analytics categorizes mappings based on complex expressions that have similar syntax within expression transformation fields.
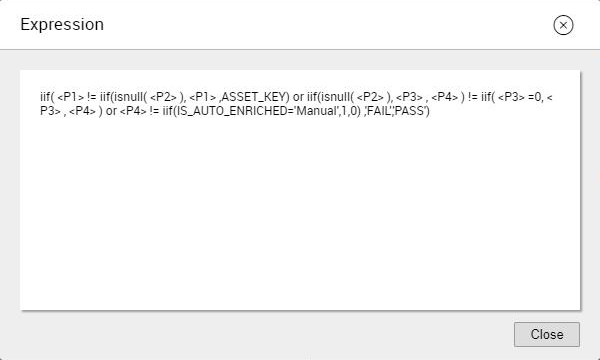
The UDF Candidates section displays the list of UDF candidates. Each candidate displays the number of fields where the UDF candidate was discovered and a link to view the expression template.
The following image displays a sample expression template:
The section also contains a table that displays the folder names where the mappings that contain the UDF candidates exist, the name of the transformation, and the mapping field where the UDF candidate was found.
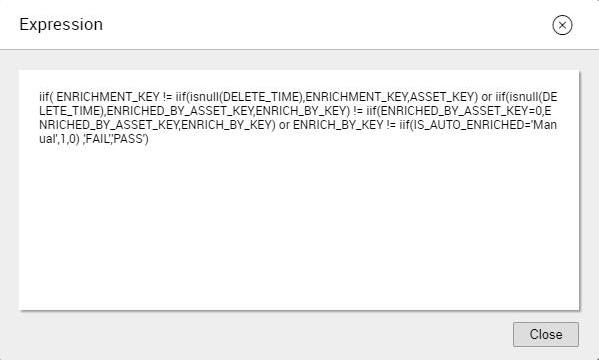
If you want to view the details of a particular mapping, click the mapping name link from the table. To view the expression, you can click the View Expression button.
The following image displays a sample expression:
Download Reports
You can export a report containing the mapping statistics for each discovered group to a Microsoft Excel (.xlsx) file. The file contains separate worksheets for summary and details for each group. To download the report for a PowerCenter resource, select the resource from the dashboard and click

.
Mapping Discovery Worksheets
The resource mapping discovery report includes the following worksheets:
- •Resource Mapping Discovery. The Mapping Discovery Description section contains a brief description about the statistics that appear in each worksheet. The Mapping Discovery Summary section contains the resource level statistics.
- •Mapping Details. Contains a list of all mappings within the resource that are part of mapping discovery groups and their corresponding statistical details.
- •Similar Mappings Summary. Contains the key statistics and the group specific summary statistics for each group within the similar mappings discovery group.
- •Similar Mappings Details. Contains a list of all mappings within the similar mappings discovery group and their corresponding details such as the group number, description, folder name, similarity score, number of sessions, and the date and time when a workflow associated with a mapping was last run.
- •Duplicate Mappings Summary. Contains the key statistics and the group specific summary statistics for each group within the duplicate mappings discovery group.
- •Duplicate Mappings Details. Contains a list of all mappings within the duplicate mappings discovery group and their corresponding details such as the group number, description, folder name, number of sessions, and the date and time when a workflow associated with a mapping was last run.
- •Mapplets Summary. Contains the key statistics and the specific summary statistics for each mapplet candidate within the mapplets discovery group.
- •Mapplets Details. Contains a list of all mappings within the mapplets discovery group and their corresponding details such as the candidate number, description, folder name, and the transformation names and types for a mapplet candidate.
- •Reusable Transformation Summary. Contains the key statistics and the specific summary statistics for each reusable transformation candidate within the reusable transformation discovery group.
- •Reusable Transformation Details. Contains a list of all mappings within the reusable transformation discovery group and their corresponding details such as the candidate number, description, folder name, and the transformation name and type.
- •UDF Summary. Contains the key statistics and the specific summary statistics for each user defined functions candidate within the user defined functions discovery group.
- •UDF Details. Contains a list of all mappings within the user defined functions discovery group and their corresponding details such as the candidate number, description, folder name, transformation name and type, field name, and the expressions that are discovered as user-defined function candidates.
Viewing Mapping Diagrams and Expressions
You can view the graphical representation of a mapping consisting of source and target definitions, transformations, and links in a mapping diagram. Reusable mapplets and transformations are highlighted in the mapping diagram for identification. For each user-defined function candidate, you can view the expression template. You can use the expression template to create user-defined functions.
To view the mapping diagram, hover over the row corresponding to the mapping, and then select View Diagram. Similarly, to view the expression template corresponding to a user-defined function candidate, select the link View Expression Template from the box that contains the candidate. The expression template consists of placeholders such as P1, P2, and P3 instead of expression values. To view the expression used in a mapping field, hover over the row containing the mapping in the table and select View Expression.
The following image displays a sample mapping diagram:
The following image displays a sample expression template:
The following image displays a sample mapping expression:


 .
.

