Data Asset Analytics Overview
Use Data Asset Analytics to optimize the data asset value in the catalog by using analytics on the data asset inventory, asset enrichment, and user collaboration.
After you configure Data Asset Analytics for Enterprise Data Catalog, the Data Asset Analytics tab is enabled in Enterprise Data Catalog. See the Informatica 10.5 Installation for Enterprise Data Catalog guide for more information about configuring Data Asset Analytics for Enterprise Data Catalog.
You can use the Dashboard and Reports pages in the Data Asset Analytics tab to analyze the catalog data.
You can directly connect to Data Asset Analytics and create reports to use data asset events in business intelligence tools. The data asset events include information on the user logins, searches, asset inventory over the time, asset changes, asset configuration scan history, user collaboration, asset enrichment, asset lineage, and asset impact.
You can also use the out of the box dashboards in Data Asset Analytics for analysis on user adoption, asset inventory, asset enrichment, collaboration, and data value. Each dashboard comes with real-time, pertinent key metrics, trend charts, and filters for quick analysis.
Data Asset Analytics provides you options to analyze the catalog data from different perspectives based on your requirement. As the catalog owner, you might be interested in knowing which resources are frequently used, what enrichments are most commonly associated with assets, or what proportion of assets are critical to your enterprise. Answers in the form of reliable, analytical data for these questions help you take decisions to enhance the catalog experience for data analysts or business users, increase the business adoption rate, and optimize the value of data assets in your enterprise.
Data Asset Analytics addresses the following key areas related to asset analytics in the catalog:
- Available Assets
- You can analyze the number of available assets, asset types, resources, and resource types during a specified period of time.
- Available Users and User Adoption Rate
- You can view the number of users who have access to the critical assets in the catalog and the number of active users who regularly access the catalog. You can also view the user adoption rate in the catalog that indicates the number of users among the provisioned users who accessed the catalog.
- Searches and Average Searches
- You can view the strings that were searched for the most and the average number of searches performed by users.
- Accessed Resources and Assets
- You can view the most accessed resources and assets in the catalog.
- Assets with Business Term and Data Domain Association
- You can view the users who performed data asset curation tasks in the catalog. Curation is the process of accepting and rejecting data domains for assets.
- Collaborators
- You can view the users who collaborated the most using reviews, ratings, questions, and answers on the assets in the catalog.
- Resource Scan History
- You can view the details about the history of resource scan settings.
- Asset Data Value
- You can assign values to resources, asset enrichments, and collaborations in the catalog. You can then view the charts that show you the analytical summary of the assets based on the values assigned to them. You can use these charts to identify the proportion of assets and resources in the catalog that are critical to you.
Data Asset Analytics User Interface
The following image shows the user interface of Data Asset Analytics with the Dashboard page open:
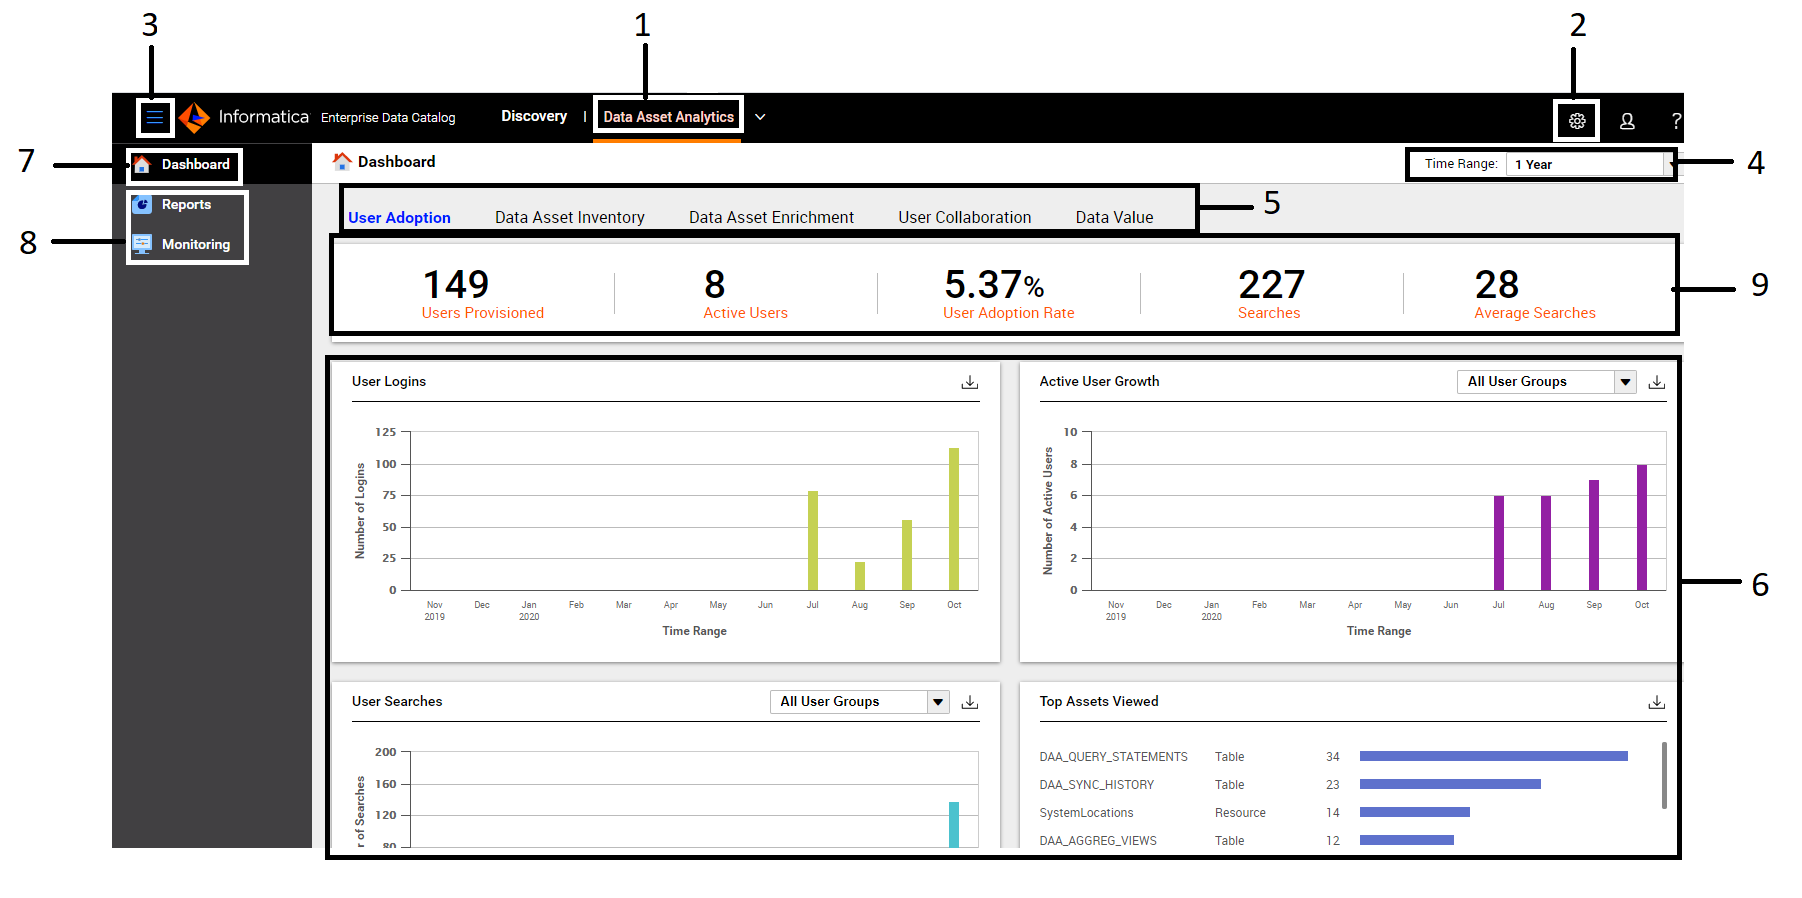
- 1. Data Asset Analytics tab to analyze the catalog data with dashboard and reports
- 2. Customize Data Asset Analytics application settings
- 3. Hide or display page names
- 4. Change the time range to view the dashboard
- 5. Dashboard tabs
- 6. Charts on the tab
- 7. Return to the Dashboard page
- 8. Open the Reports or Monitoring page
- 9. Key metrics of the dashboard tab