Data Asset Inventory
The Data Asset Inventory tab displays analytical charts and statistics for the resources and assets created and available during the specified time range in the catalog.
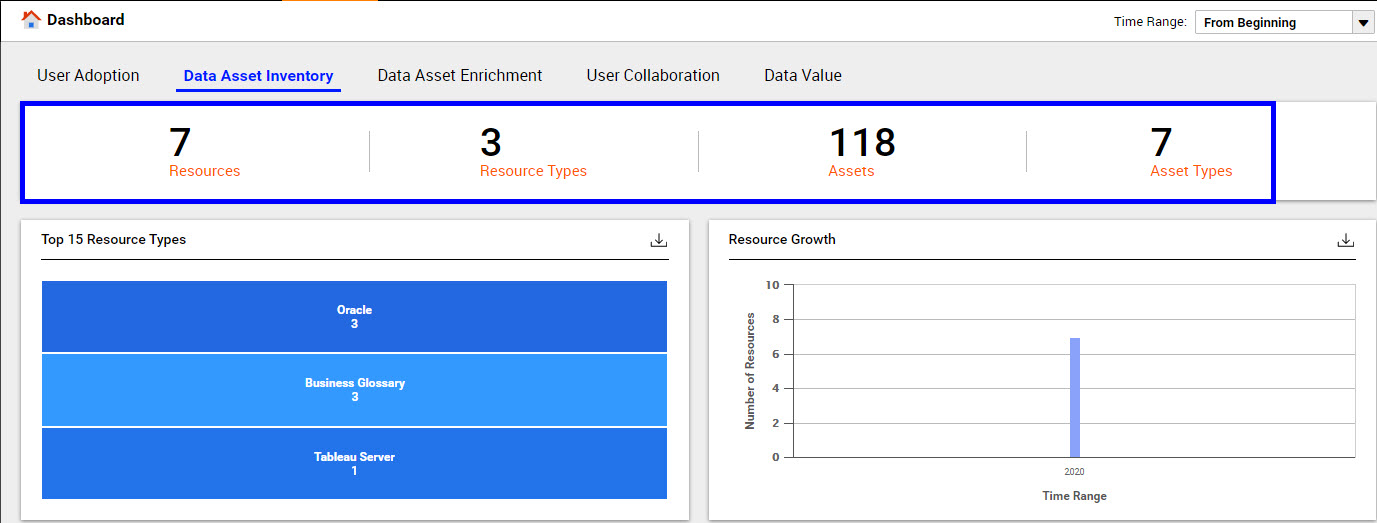
The following image shows a sample Data Asset Inventory tab with the key metrics highlighted:
Data Asset Inventory Key Metrics
You can view the following key metrics on the Data Asset Inventory tab:
- Resources
- Displays the total number of resources scanned and available in the catalog during the specified time range. The key metric does not include the system resources.
- Resource Types
- Displays the total number of resource types available in the catalog during the specified time range. The key metric does not include the system resource types.
- Assets
- Displays the total number of assets from resources and system resources available in the catalog during the specified time range. The key metric includes the number of resources but does not include the number of system resources.
- Asset Types
- Displays the total number of asset types available in the catalog during the specified time range. The key metric includes the number of resource types but does not include the number of system resource types.
Data Asset Inventory Charts
You can view the following charts on the Data Asset Inventory tab:
- Top 15 Resource Types
- The chart displays the top 15 resource types in descending order based on the total number of resources of the same type in the catalog.
- Resource Growth
- The chart displays the total number of resources added to the catalog from the time you configured Data Asset Analytics. You can move your mouse pointer on the bar graph to view the exact count of resources. The X axis of the chart represents the time range and the Y axis represents the total number of resources.
Note: The Resource Growth and Top 15 Resource Types charts do not include the system resources.
- Asset Growth
- The chart displays the total number of assets from resources and system resources added to the catalog from the time you configured Data Asset Analytics. You can move your mouse pointer on the bar graph to view the exact count of assets. The X axis of the chart represents the time range and the Y axis represents the total number of assets. Click the All Resources drop-down list to select a specific resource for which you want to view the chart.
- Asset Changes
- The chart displays the total number of assets from resources and system resources that had changes in the data source during the specified time range. You can move your mouse pointer on the bar graph to view the exact count of assets. The X axis of the chart represents the time range and the Y axis represents the total number of assets with changes. Click the All Resources drop-down list to select a specific resource for which you want to view the chart. The chart includes a legend to represent the asset changes as shown in the following image:

Note: The Asset Growth and Asset Changes charts do not include the count of system resources, but the charts include the count of assets within system resources when you do not select a specific resource from the All Resources drop-down list.
Downloading the Chart Data
For charts that provide the

option, you can click
to download the chart in CSV format. You can use the downloaded chart in third-party reporting tools to add or enhance reporting details based on your requirements.