Data Flow Analytics Overview
Use Data Flow Analytics to view statistical information about the mappings that exist in PowerCenter resources.
You can view key metrics about mappings in PowerCenter resources. The key metrics include the number of resources, folders, workflows, and mappings. You can also view the mapping discovery metrics associated with each resource such as the number of mappings and the date on which the mappings were discovered.
Data Flow Analytics analyzes mappings. It performs analyses such as similar mapping analysis and duplicate mapping analysis. The analyses also include mapplet candidate analysis, reusable transformation candidate analysis, and user-defined function candidate analysis. For each mapping resource, you can view the percentage of mappings for each analysis type with respect to the total number of mappings.
To view the mapping details specific to a resource, you can click the resource name from the dashboard page. At the resource level, for each mapping analysis type, the discovered mappings are organized into multiple groups.
Data Flow Analytics User Interface
After you configure Data Asset Analytics for Enterprise Data Catalog, the Data Flow Analytics tab is enabled in Enterprise Data Catalog.
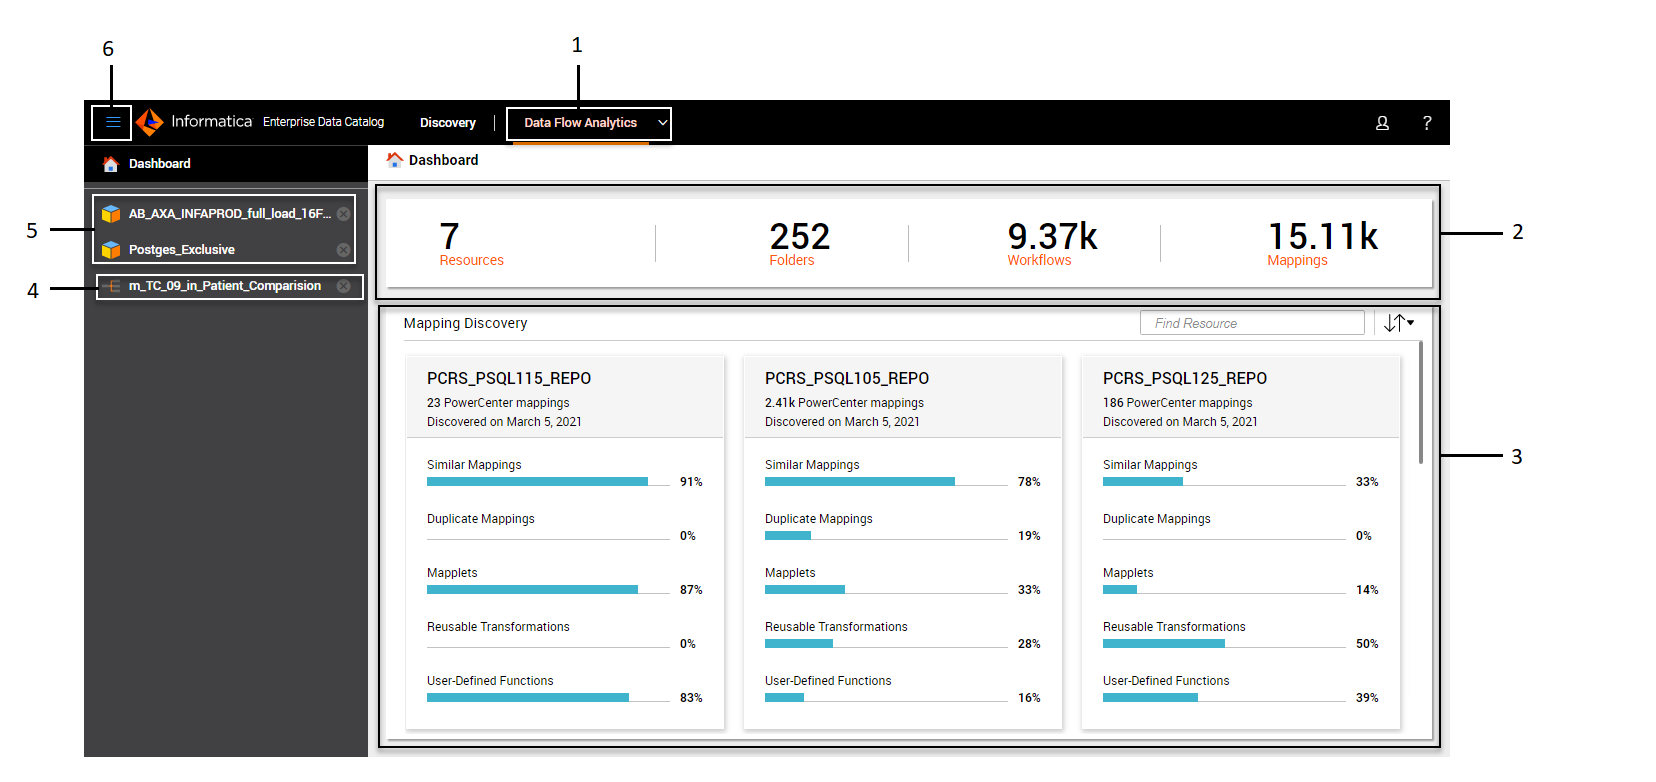
The following image shows the user interface of Data Flow Analytics with the
Dashboard page open:

- 1. Data Flow Analytics tab to view the discovered mappings from PowerCenter resources
- 2. Key metrics about PowerCenter Resources
- 3. View the mapping discovery metrics for each PowerCenter resource
- 4. List of mappings that you have previously accessed
- 5. List of resources that you have previously accessed
- 6. Hide or display page names


