Data Value
Use the Data Value tab to assign the value to assets in the catalog and analyze the catalog based on the value that you assigned to resource types, asset enrichment, feature usage, and collaboration.
The tab displays analytical charts and statistics based on the data value in different panels. You can use these charts to identify the proportion of assets and resources in the catalog that are critical to you. The information that you view in the panels depend on the time range that you specify.
The following image shows a sample Data Value tab with the key metrics highlighted:
Data Value Key Metrics
You can view the following key metrics on the Data Value tab:
- Data Value
- Displays the sum of values that you assigned to resources, asset enrichment, feature usage, and collaboration.
- Resource Value
- Displays the value for all the resources by adding the adding the following values:
- - Multiply the specified resource type value with the total number of assets selected based on the asset keywords specified.
- - Multiply the value specified for all other resource types with the total number of assets selected based on the asset keywords specified.
Note: You can specify the asset keywords in the Asset Keywords for Resource Value Calculation text box in Application Configuration.
- Asset Enrichment Value
- Displays the value that you assigned to all the asset enrichment activities in the catalog. The asset enrichment value is calculated based on the value that you specify for number of asset enrichment activities.
- Feature Usage Value
- Displays the value of Enterprise Data Catalog features based on their usage and configured values.
- Collaboration Value
- Displays the value that you assigned to all the collaboration activities in the catalog. The collaboration value is calculated based on the value that you specify for number of collaboration activities.
Data Value Charts
The tab displays the data value in statistical and graphical format. The charts show the change in values over a specified time range. You can view multiple data value charts into a single view using the Combine Chart option.
You can view the following charts with data value information on the Data Value tab:
- Resource Value
- The chart displays the total value calculated for all resource types based on the assets in the catalog over a specified period of time. The Y axis of the chart represents the values ranging from lowest through highest. The X axis of the chart represents the time range. You can click
 ( Open Value Calculator) to calculate and assign a value to the resource types. You can specify the list of assets to be selected as asset keywords in the application configuration. You can hover over the value indicators on the chart to view the assigned value for a particular time range.
 - Asset Enrichment Value
- The chart displays values assigned to asset enrichment activities over a specified period of time. The Y axis of the chart represents the values ranging from lowest through highest. The X axis of the chart represents the time range. You can use the calculator ( Open Value Calculator) to calculate and assign a value to the asset enrichment activities. You can hover over the value indicators on the chart to view the assigned value on a particular time range.
- Feature Usage Value
- The chart displays the value of Enterprise Data Catalog features based on their usage over a period of time. The X axis of the chart displays the time range in months and the Y axis displays the usage value of features. You can move the mouse pointer over the value indicators on the chart to view the value for that time range. The chart uses the values you assign for the features in the Feature Usage Value calculator dialog box. You can access the dialog box by clicking (Open Value Calculator) on the top left part of the chart.
- Collaboration Value
- The chart displays values assigned to collaboration activities over a specified period of time. The Y axis of the chart represents the values ranging from lowest through highest. The X axis of the chart represents the time range. You can use the calculator to calculate and assign a value to the collaboration activities. You can hover over the value indicators on the chart to view the assigned value on a particular time range.
Downloading the Chart Data
For charts that provide the

option, you can click
to download the chart in CSV format. You can use the downloaded chart in third-party reporting tools to add or enhance reporting details based on your requirements.
Calculating the Resource Value
Use the resource calculator to estimate and analyze the total value of resources based on the assets selected from the catalog. The assets are selected based on the asset keywords that you specify in application configuration for resource value calculation.
To calculate the resource value, provide a value in the Resource Value Calculator. Provide a value ranging between the minimum and maximum value limit. The administrator can customize the minimum and maximum range of the value calculator on the Application Configuration page.
You can assign a value to all the resource types or you can choose to assign values to individual resource types.
To assign a value to resource types, perform the following steps:
- 1. From the Resource Value section, click the value calculator icon .
The Resource Value Calculator window appears.
- 2. In the Search and add resource types text box, type the name of the required resource type for which you want to assign a value. The list of resource types that match with what you type, appears.
- 3. From the list of resource types, select the required resource type. The resource type is added as a resource type for which you can allocate a value.
- 4. Optional. Repeat steps 2 and 3 to add more resource types as required.
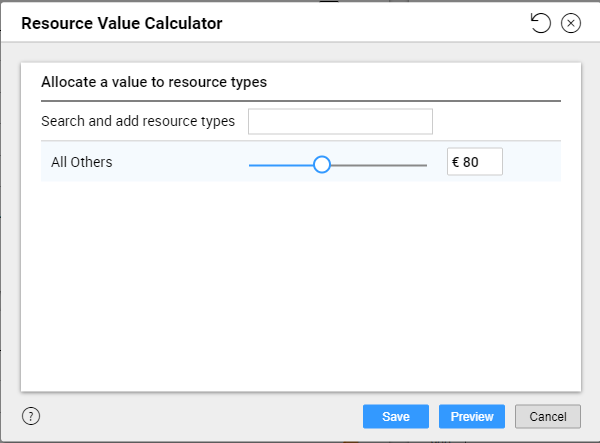
- 5. Use the value slider to drag and assign a value to all the resource types. If you do not assign a value specifically for a resource, the resource calculator considers the value that you assign to resource types using the All Others slider.
- 6. Click Save to save the value instantly or click Preview to preview the value before saving. Optionally, click the (
 ) icon to reset to the previously saved value.
The following image displays the sample Resource Value Calculator dialog box:
Example 6. Example
The following table lists the resources and assets in the catalog along with the count of the assets:
Resource Type | Asset Type | Count |
|---|
Oracle | Table | 100 |
Business Glossary | Term | 50 |
Oracle | Column | 2000 |
Informatica Platform | Mapping | 1000 |
All | File | 500 |
You need to calculate the resource value based on the assets listed in the table using the following values:
- •Oracle. $10
- •Business Glossary. $5
- •OneDrive $10
- •Informatica Platform. $25
- •All file-type resources that include JSON files, Excel files, and XML files. $10
To configure the resource value calculation, specify the asset types listed as Asset Keywords for Resource Value Calculation in Application Configuration. In addition, select the Currency as US Dollar and specify the required values in the minimum and maximum fields for the Value Calculator.
To calculate the resource value, open the Resource Value Calculator and specify the following values for the resource types in the calculator:
- •Oracle. $10
- •Business Glossary. $5
- •Informatica Platform. $25.
- •All Others. $10
The Resource Value Calculator calculates the resource value by adding the following numbers::
- •Oracle. 100 tables * $10+ 2000 columns *$10
- •Business Glossary. 50 terms * $5
- •Informatica Platform. 1000 mappings * $25
- •All Others. 500 file type resources * $10
Calculating the Asset Enrichment Value
Use the Asset Enrichment Value calculator to estimate and analyze the value of all the asset enrichment activities in the catalog.
To calculate the asset enrichment value, provide a value in the Asset Enrichment Value Calculator. Provide a value ranging between the minimum and maximum value limit. You can assign values to all the enrichment activities.
By default, the asset enrichment value calculator displays the value ranging from 0 through 100. The Administrator can customize the minimum and maximum range of the value calculator on the Application Configuration page.
The Asset Enrichment Value Calculator estimates the value of asset enrichment activities based on the following calculation:(Number of Asset Enrichment Activities × User Specified Value)
To assign values to enrichment activities, perform the following steps:
- 1. From the Asset Enrichment Value section, click the value calculator icon .
The Asset Enrichment Value Calculator window appears.
- 2. In the Allocate a Value to Data Enrichments section, use the value sliders to drag and assign values to all the enrichment activities.
- 3. Click Save to save the value instantly or click Preview to preview the value before saving. Optionally, click the () icon to reset to the previously saved value.
The following image displays the sample Asset Enrichment Value Calculator window:
Example 7. Example
The catalog includes assets with business description, business term, and data domain enrichments. The catalog includes two instances of each asset enrichment activity. You are asked to calculate the value of all the asset enrichment activities. To calculate the asset enrichment value, you open the Asset Enrichment Value Calculator and specify the following values for enrichment options in the calculator:
- •Business Description. You provide 20 $ value.
- •Business Term. You provide 30 $ value.
- •Data Domain. You provide 40 $ value.
The Asset Enrichment Value Calculator estimates the value based on the values you specified with the following calculation:
(Number of Asset Enrichment Activities × User Specified Value)
In this example, the Asset Enrichment Value is 180 $.
The following table shows the details of the calculation:
Enrichment Type | Number of Instances | User Specified Value | Calculated Value |
|---|
Business Description | 2 | 20 $ | 40 $ |
Business Term | 2 | 30 $ | 60 $ |
Data Domain | 2 | 40 $ | 80 $ |
Total Value | - | - | 180 $ |
Calculating the User Collaboration Value
Use the Collaboration Value calculator to estimate and analyze the value of all the user collaboration activities in the catalog.
To calculate the user collaboration value, provide a value in the Collaboration Value Calculator. Provide a value ranging between the minimum and maximum value limit. You can assign values to all the collaboration activities.
By default, the user collaboration value calculator displays the value ranging from 0 through 100. The administrator can customize the minimum and maximum range of the value calculator on the Application Configuration page.
The Collaboration Value Calculator estimates the value of user collaboration activities based on the following calculation:(Number of User Collaboration Activities × User Specified Value)
To assign values to collaboration activities, perform the following steps:
- 1. From the Collaboration Value section, click the value calculator icon .
The Collaboration Value Calculator window appears.
- 2. In the Allocate a value to collaboration activities section, use the value sliders to drag and assign values to all the collaboration activities.
- 3. Click Save to save the value instantly or click Preview to preview the value before saving. Optionally, click the () icon to reset to the previously saved value.
The following image displays the sample Collaboration Value Calculator window:
Example 8. Example
The catalog includes assets with questions, answers, and reviews. The catalog includes three instances of each user collaboration activity. You are asked to calculate the value of all the user collaboration activities. To calculate the user collaboration value, you open the Collaboration Value Calculator and specify the following values for collaboration activities in the calculator:
- •Questions. You provide 30 $ value.
- •Answers. You provide 40 $ value.
- •Reviews. You provide 50 $ value.
The Collaboration Value Calculator estimates the value based on the values you specified with the following calculation:
(Number of User Collaboration Activities × User Specified Value)
In this example, the Collaboration Value is 360 $.
The following table shows the details of the calculation:
Enrichment Type | Number of Instances | User Specified Value | Calculated Value |
|---|
Business Description | 3 | 30 $ | 90 $ |
Business Term | 3 | 40 $ | 120 $ |
Data Domain | 3 | 50 $ | 150 $ |
Total Value | - | - | 360 $ |
Calculating the Feature Usage Value
Use the Feature Usage Value calculator to assign values of your choice to the features in Enterprise Data Catalog.
Data Asset Analytics uses the values to display the Feature Usage Value chart on the Data Value tab page. The Feature Usage Value chart displays the value of the Enterprise Data Catalog features based on their usage over a period of time.
The feature usage increases every time you access the feature for which you assigned a value. Repeated access to the feature from the same view does not add up the usage value for the feature. However, if you navigate away from the view and access the feature again, the usage value increases.
To assign values to features, perform the following steps:
- 1. On the Feature Usage Value chart, click (Open Value Calculator).
The Feature Usage Value Calculator dialog box appears.
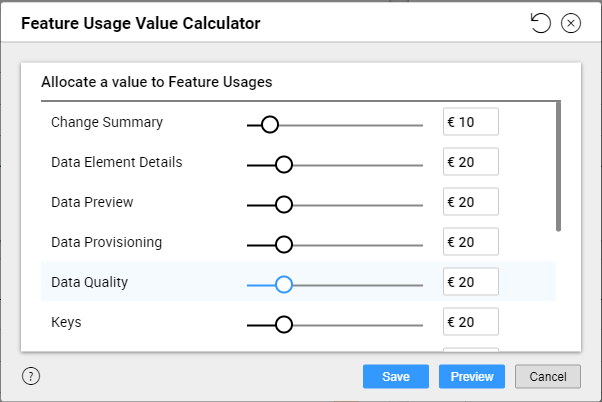
- 2. Assign values as required for the following features in the Allocate a value to Feature Usages section:
Feature | Description |
|---|
Change Summary | Summary of resource changes when there are changes to the source data associated with the resource after a scan. |
Data Element Details | Data Element Details refers to the details included in an asset. For example, the following assets include the listed details in associated tabs: - - A table asset displays the columns in the Columns tab.
- - A rule asset displays the list of tables linked to the rule in the Where Used tab.
- - A file asset displays the fields in the Contains tab.
|
Data Preview | Preview data using the Data Preview tab before you provision data. |
Data Provisioning | Provision data for further analysis and processing using the Data Provisioning tab. |
Data Quality | The Data Quality tab that displays the rules and scorecards for a tabular asset. |
Keys | The Keys tab that displays the details of the unique keys and foreign keys for assets such as tables and files. |
Lineage and Impact | The Lineage and Impact tab that shows the end-to-end flow for an asset. |
Metric Groups | The Metric Groups column on the Data Quality > Scorecards tab page that displays the names of the metric groups. |
Overview | The Overview tab that displays the asset details. |
Questions | The Questions section on the Overview tab for an asset. |
Relationships | The Relationships view that shows the relationship between an asset and other assets in the catalog. |
Reviews | The Reviews section on the Overview tab for an asset. |
- 3. Click Save to save the value instantly or click Preview to preview the value before saving. Optionally, click the () icon to reset to the previously saved value.
The following image displays the sample Feature Usage Value Calculator dialog box:
Example 9. Example
Assign values to the following features in the Feature Usage Value Calculator dialog box:
Feature | Value |
|---|
Overview | $10 |
Lineage and Impact | $20 |
Questions | $5 |
Reviews | $5 |
Data Elements | $10 |
The following table lists the feature access details and the usage value calculation:
Feature Used | Calculation |
|---|
Overview | 1 x $10 for accessing the Overview tab. |
Lineage and Impact tab of 10 separate assets | The usage value is calculated by adding the following values: - - 10 x $20 for accessing the Lineage and Impact tab of 10 separate assets
- - 10 x $10 for accessing the Overview tab that opens by default when you click an asset.
|
Questions and Reviews tabs of an asset | The usage value is calculated by adding the following values: - - 1 x $5 for accessing the Questions section of the asset.
- - 1 x $5 for accessing the Reviews section of the asset.
- - 1 x $10 for accessing the Overview tab that opens by default when you view an asset.
|
Overview tab of an asset, followed by the Lineage and Impact, Questions, and Overview tabs of the same asset. | The usage value is calculated by adding the following values: - - 1 x $20 for accessing the Lineage and Impact tab.
- - 1 x $5 for accessing the Questions section
- - 1 x $10 for accessing the Overview tab.
|
Columns tab for an asset | The usage value is calculated by adding the following values: - - 1 x $10 for accessing the Overview tab.
- - 1 x $10 for accessing the Columns tab or the Data Element Details.
|
To customize the feature values, you can specify the minimum and maximum range of the values in the Value Calculator on the Application Configuration page.


