Lineage and Impact Tasks
You can perform several tasks in the Lineage and Impact tab, such as customize the view, display child assets for the seed asset, display the intermediate assets that are upstream and downstream of the seed asset, display the intermediate assets within any indirect link, display business terms in the view, and display the transformation logic for assets in the view.
Customizing the Diagram and Compact View
You can customize the diagram and compact view to zoom and pan the diagram, and open the asset summary view. Customize the view through the controls at the top of the view and the configuration panel. You can also pan the view by clicking and dragging the diagram.
The following table describes the controls that you can use to customize the view:
Control | Description |
|---|
Zoom controls | Zoom in, zoom out, select the zoom percentage, view actual size, or fit the diagram to the window. You can also use the scroll wheel on your pointing device to zoom in and out. |
Center control | Reposition the diagram so that the seed asset is in the center. |
Asset summary view | Open the lineage, impact, and control summary tabs. |
Menu | Print the diagram, export the diagram, and show or hide the legend. |
<< or >> | Open or close the configuration panel. Use the configuration panel to view the links that you expanded, to display or hide business glossary terms, and to pan the diagram. To pan the diagram, drag the blue rectangle over a different part of the mini map. |
Find text box | Search for specific assets or objects in the lineage diagram using the Find text box. |
Displaying Child Assets
You can display the child assets for the seed asset in a lineage and impact diagram and compact view. When you display the child assets, the view shows the children of other assets that affect and are affected by the child assets that you selected.
You can display child assets for data structures such as relational tables, database queries, and business intelligence workbooks and reports. Columns and fields do not have child assets.
When you display child assets, you can display all child assets or select specific child assets to display. If the child assets that you select are within other data structures, the diagram displays the child assets within the data structures that contain them. For example, if the seed asset is an Oracle Business Intelligence Enterprise Edition report, and you select a report field, the diagram displays the field within the report page.
The following image shows the sample diagram view for a relational table with some child columns displayed:
- 1. Seed asset
- 2. Child assets
- 3. Reset icon. Hides all child assets in the seed asset.
- 4. Drill down icon. Allows you to select the child assets to display in the diagram.
The following image shows the sample compact view for a relational table with some child columns displayed:
- 1. Child assets
- 2. Seed asset
- 3. Reset icon and Drill down icon.
To display child assets:
1. Click the drill down icon ( ) in the upper right corner of the seed asset.
 2. In the Drill Down dialog box, select the child assets that you want to display.
To search for a child asset, enter the first few characters of the asset name in the Find field. To select all child assets, check the check box next to the Name column.
3. Click OK.
The lineage and impact diagram displays the child assets that you select and the assets to which the child assets are linked.
To hide all child assets, click the reset icon (

).
Displaying Upstream and Downstream Assets
You can display the intermediate assets that are upstream and downstream of the seed asset. To display the intermediate assets, use the Lineage and Impact sliders.
The following image shows the Lineage and Impact sliders:

When the sliders are at the first position to the right of the Hide position, the diagram displays the origins, seed asset, and destinations. To display additional upstream assets, move the Lineage slider to the right. To display additional downstream assets, move the Impact slider to the right.
The sliders display additional assets by distance from the seed asset. A hop indicates the distance of an asset from the seed asset. For example, the complete data flow for asset D is A -> B -> C -> D -> E -> F -> G. Assets C and E are one hop from asset D. Assets B and F are two hops from asset D.
The number of positions on the sliders varies based on the number of hops as follows:
- •If a diagram has 10 or fewer hops, each slider position represents one hop. If you move the Lineage slider one position to the right, the diagram displays the assets in the next upstream hop.
- •If a diagram has more than 10 hops, each slider position represents multiple hops. For example, in a diagram with 100 hops, each slider position represents 10 hops. If you move the Impact slider two positions to the right, the diagram displays the assets in the first 20 downstream hops.
To fully expand the diagram, move the Lineage and Impact sliders to the Show All positions.
To hide all upstream assets, move the Lineage slider to the Hide position. To hide all downstream assets, move the Impact slider to the Hide position.
Displaying Upstream and Downstream Asset Examples
Use the Lineage and Impact sliders to display intermediate assets in the diagram view.
The following image shows the sample diagram view for a relational column:

When you move the Impact slider two positions to the right, the diagram displays the first and second downstream hops.
The following image shows the diagram with the first and second downstream hops displayed:

When you move the Lineage slider one position to the right and the Impact slider to the Hide position, the diagram displays the asset in the first upstream hop and hides all downstream assets.
The following image shows the diagram with the first upstream hop displayed and the downstream assets hidden:

When you move both sliders to the Show All positions, the diagram is fully expanded.
The following image shows the fully expanded diagram:

Displaying Assets within a Link
You can display the intermediate assets within any indirect link. Indirect links are represented by dashed lines. To display the assets within an indirect link, hover over the link and click the plus sign (+) that appears.
When you click +, the link expands and displays all of the intermediate assets within the link.
The following image shows an expanded link between two relational tables:

- 1. The link between the seed and the destination asset is expanded to show an intermediate asset.
- 2. In the configuration panel, the Expanded Paths list shows the expanded links. To collapse a link, click X.
To view a list of the expanded links, click << to open the configuration panel. Each link that you expand is listed in the Expanded Paths list.
In the Expanded Paths list, the expanded links are named as follows:
- •If you expand a link that is upstream of the seed asset, the expanded link is named for the upstream asset. For example, if you expand the link between origin asset "BUDGET" and seed asset "costfact," the Expanded Paths list shows "BUDGET" as an expanded link.
- •If you expand a link that is downstream of the seed asset, the expanded link is named for the downstream asset. For example, if you expand the link between seed asset "costfact" and downstream asset "CostRatioReport," the Expanded Paths list shows "CostRatioReport" as an expanded link.
You can collapse any expanded link from the Expanded Paths list in the configuration panel. To collapse an expanded link, click X next to the link that you want to collapse.
Displaying Business Terms
You can display business terms in a lineage and impact diagram and compact view. Display business terms when assets in the diagram or compact view have names that are cryptic or difficult to understand. Use the configuration panel to display and hide business terms.
To display business terms:
1. Click << in the lower right corner of the view to open the configuration panel.
2. Enable the Show Business Terms option.
The view shows the business terms for all assets that have associated business terms.
To hide business terms, disable the Show Business Terms option.
Displaying Transformation Logic for Assets
You can display the transformation logic for assets in the diagram and compact view. A transformation is a repository object that generates, modifies, or passes data from source to target connections.
You can choose to display the transformation logic for assets that contain transformations in the diagram and compact view.
When you click the transformation logic button (

) in the diagram or compact view, the view displays transformation icons on the assets that contain transformations. Assets that display transformation icons in the view are target assets in the transformation logic view. The view displays transformation logic for resource types, such as PowerCenter, Informatica Cloud Services, Informatica Platform, and Cloudera Navigator.
The transformation icon for PowerCenter and Informatica Cloud Services resource types indicate that a mapping exists between source assets and target assets. A mapping is a set of inputs and outputs that represent the data flow between sources and targets. A mapping contains components such as source objects, target objects, and transformations. The transformation icon for Cloudera Navigator resource type indicates that a data flow relation type exists between source assets and target assets.
Transformation logic view displays all the mappings or data flow relation types between the source assets and target assets for the resource type that you select. The transformation logic view, by default, displays the source assets, transformations, and target assets. The view also displays the properties panel to view details about assets in a mapping or data flow relation type.
If an asset contains multiple transformation logic between the source assets and target assets, the view displays a drop-down menu when you hover over the transformation icon. The drop-down menu lists all the resource types that contain transformation logic. You can select a resource from the drop-down menu for which you want to view the transformation logic.
The transformation view displays transformation logic for data structures, such as tables and columns. The view displays various types of transformations, such as filter, joiner, lookup, expression, sorter, union, and aggregate.
The following image shows a sample transformation logic for a relational table in the diagram view:

- 1. Source asset
- 2. Transformation logic
- 3. Target asset
- 4. Menu
- 5. Fit to window
- 6. Zoom controls
- 7. Show business terms
Example
Mike, a developer in your organization needs to find out how a field named Cost_Ratio in a Tableau report is derived using transformations. The developer searches for Cost_Ratio in the catalog and opens the diagram view for the asset. The diagram view displays different tables that contribute to the asset. To analyze the asset further, in the diagram view, he chooses to display transformation icons and opens the asset Cost_Ratio, which contains a transformation. He then finds out that the asset is derived using a PowerCenter transformation.
Transformation Logic View Tasks
You can enable the transformation logic in the diagram view, expand a table, view the table and column level transformation, and view the properties panel. Before you choose to display transformation logic in Enterprise Data Catalog, you must make sure that you have configured transformation logic for resource types such as Powercenter, Cloudera Navigator, and Informatica Cloud Services in Catalog Administrator.
You can perform the following transformation logic view tasks:
- View Transformation in the Diagram View
- In the diagram view, you can choose to display transformation logic for assets that contain transformations.
- To view the transformation logic in the diagram view, click the transformation logic button () at the upper right corner of the view.
- When you enable transformations, the view displays transformation icons (
 ) next to the asset names indicating that there are mappings or data flow relation types between the source assets and target assets.
 - To go back to the diagram view, click the asset name link at the upper left corner of the transformation logic view.
Note: The diagram view does not display transformation icons next to the asset names if assets do not contain transformations.
- Drill Down on a Table in the Transformation Logic View
- You can drill down on a table if you want to select and display fields in the transformation logic view. When you drill down on the table, the transformation logic view displays source fields, ports in the mapping, and target fields. Perform the following steps to expand a table in the transformation logic view:
- 1. Click the (
 ) drill down icon next to the table name in the transformation logic view. The Select window appears.
 - 2. In the Select window, select the fields you want to display in the transformation logic view.
- 3. Click OK. The transformation logic view then displays the source fields, mapping with ports, and target fields for the selected fields.
- 4. To go back to the table-level transformation, click the back icon button at the upper right corner of the transformation logic view.
- View the Properties Panel in the Transformation Logic View
- You can view the properties panel in the transformation logic view. The properties panel displays general details of assets in a mapping such as the name of the resource, type of the resource, and last modification date of the resource. The asset information that you view depends on the type of mapping you see in the transformation logic view.
- To view the properties panel in the transformation logic view, hover over the asset name in the mapping and click the asset name.
- You can download the property details to a flat file ( .txt) file. To download the property details, click the download icon (
 ) at the upper right corner of the properties panel.
 - View the Table-Level Transformation
- When you display the table-level transformation, the transformation logic view by default displays the source table, mappings, and the target table. The mapping includes transformations, source qualifier, and target transformation. You can expand the source table or target table to view fields and ports in the transformation logic view.
- View the Field-Level Transformation
- When you display the field-level transformation, the transformation logic view by default displays the source fields, mapping, and target fields. The mapping includes transformation ports, source qualifier ports, and target transformation ports.
- To view transformation at the field level, you must expand the table and select fields you want to view in the transformation logic view. Alternatively, you can open a field in the diagram view and then enable transformation to view if the field contains transformation logic.
Customizing the Transformation View
You can customize the transformation diagram to zoom in and out of the diagram, undo the changes, fit the diagram to the window, pan the diagram, export the diagram, print the diagram, and show or hide the legend.
Customize the view using the controls at the top of the diagram and the configuration panel. You can also pan the diagram by clicking and dragging the diagram.
The following table describes the controls that you can use to adjust the view:
Control | Description |
|---|
Zoom | Zoom in and out of the transformation view. |
Undo | Undo the changes. |
Fit to window | Fit the diagram to the window. |
| Print the diagram, export the diagram, and show or hide the legend. |
<<, >> | Open or close the configuration panel. Use the configuration panel to pan the diagram. To pan the diagram, drag the blue rectangle over a different part of the mini map. |
Viewing the Context Information
You can use Enterprise Data Catalog to view the context information associated with a process definition, or a mapping execution. A process definition refers to parameters that define the data flow of multiple source and target assets. The process definition types include stored procedure or mapping definitions. You can view context information for assets on the Lineage and Impact tab. Enterprise Data Catalog extracts the context information associated with lineage for assets from custom resources that you create in Catalog Administrator.
View context information to determine where a process definition is used in the data flow that includes multiple source and target assets. The dataflow of an asset can include multiple execution instances for the same set of sources or targets. Each execution instance represents a context. For example, when you run a resource that includes a mapping definition with multiple mapping instances created using a parameter file, the mapping definition generates different lineage and impact information based on the specified parameter file. In this example, context refers to specified mapping instance.
Example
You are a developer in an organization and you know that a relational table is associated with a process definition. The process definition includes multiple source and target assets from different context executions. You want to view the lineage and impact information of the process definition so that you can view all the source and target assets that the process definition includes in each of its context execution. To achieve this goal, in Catalog Administrator, you load the process definition and related execution instances into Enterprise Data Catalog. After you load the process definition related information, you then open the process definition on the Overview tab and then select a specific context to view the process definition information based on the context on the Lineage and Impact tab.
To open the process definition asset and the related context or execution instances, type the process definition name in the search box, and then click the process definition name link on the search results page. Alternatively, perform the following steps:
- 1. Open the asset that includes a process definition on the Lineage and Impact tab, and then click the transformation logic button () to view the transformation icon. The transformation icon on the asset indicates that there is a process definition between the source and target assets.
- 2. To open the process definition on the Overview tab, click the number icon that appears next to the process definition name. The number icon indicates that the process definition includes multiple context executions.
The following image displays the sample Lineage and Impact view that includes context information:
- Viewing the context information on the process definition Overview tab
- When you open the process definition Overview tab, the tab displays different contexts that are associated with the process definition in the Context section.
- The Context section displays the details, such as the name of the context, source and target assets that the process definition includes in a particular context, and the type of the source and target assets. The context name is based on the context ID that you define in the objects.csv file. Each context in the process definition is associated with different source and target assets.
The following image shows a sample Context section from the process definition Overview tab:
- Viewing the lineage and impact information of the process definition based on a specific context
- To view the lineage and impact information of the process definition based on a context, select a specific context that you want to view from the Context section, and then click Lineage and Impact. You can select and open one context at a time.
When you open the process definition on the Lineage and Impact tab, the tab displays all the source and target assets that the process definition includes for a specific context that you selected.
To view the process definition with a different context on the Lineage and Impact tab, click the Choose another context link and select the context from the Context section, and then click Lineage and Impact.
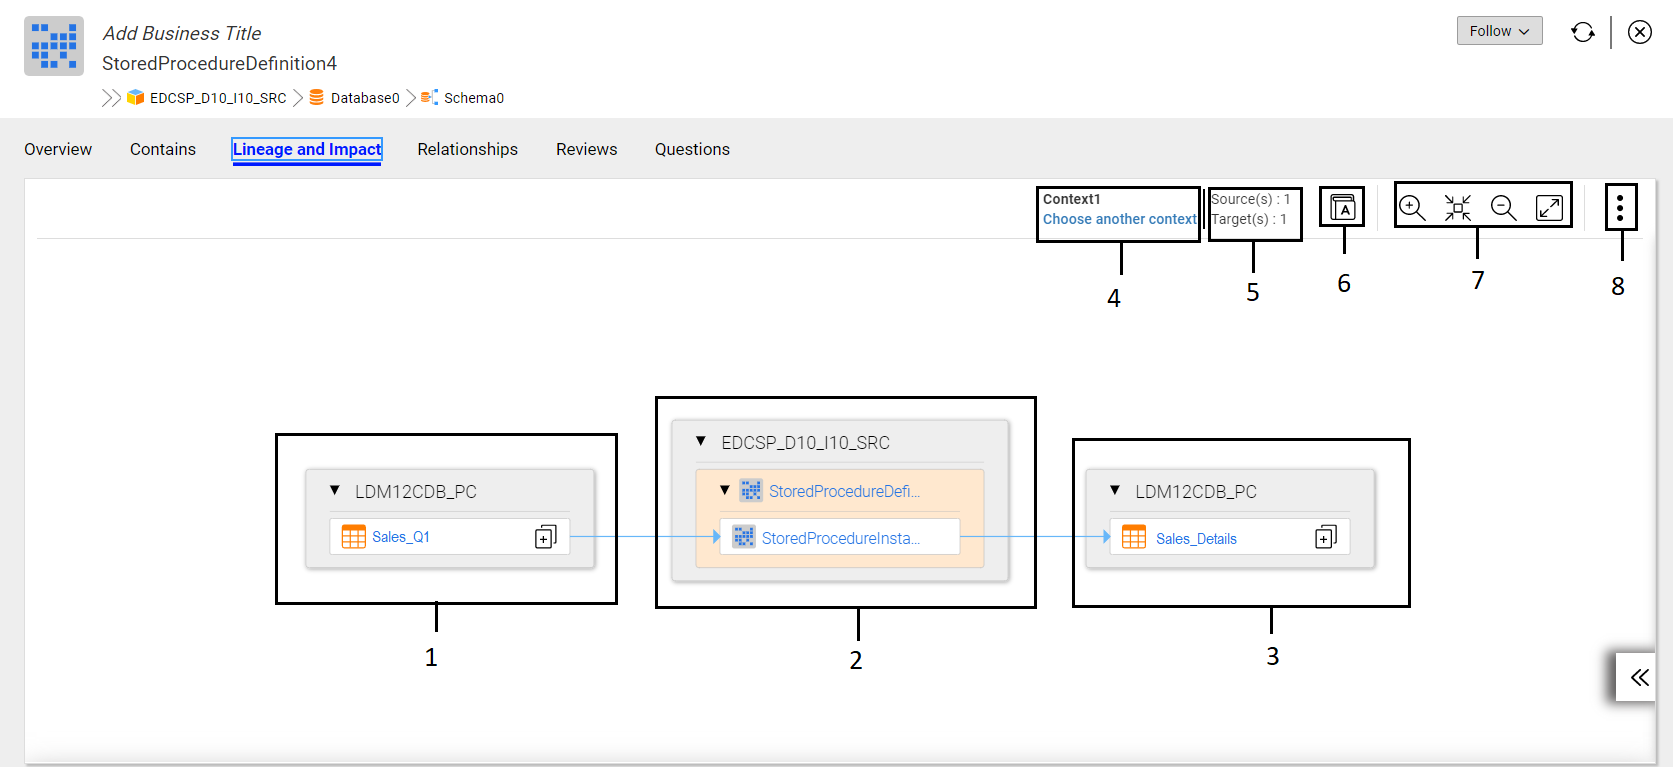
The following image shows a sample Lineage and Impact view for a context from the process definition Overview tab:
- 1. Source assets associated with process instances
- 2. Process instance
- 3. Target assets associated with process instances
- 4. Name of the context that is open and the link to select another context
- 5. Number of sources and targets in the view
- 6. Show associated business term
- 7. Customize the view with zoom controls
- 8. Export or print the view
For information about configuring a custom resource to extract context lineage information, see the Context Lineage Support for Custom Resources topic in the Informatica Catalog Administrator guide.
Filtering the Diagram and Compact View
You can create and apply filters to the diagram and compact view. Use filters to narrow down the results in the view. Create customized filters using different combinations of filter options based on the asset types available in the view.
Create a filter based on the Hide assets and retain their links, Hide assets and their links, Hide assets at leaf nodes, Relationship, and Direction filter options.
As part of filtering the results, you can hide the assets at different points in the lineage and impact diagram or compact view. You can hide assets while retaining their links to other assets, hide both assets and their links to other assets, and hide assets at the leaf nodes of the diagram. A leaf node represents an asset that is at the end of either side of the origins and destinations.
When you apply a filter to diagram or compact view, the view hides specific asset types on both Lineage and Impact sides. The filter that you apply to the diagram or compact view does not affect the seed asset.
You can save the filter criteria and use the saved filter setting on any diagram or compact view in the Catalog. You can also create and apply a default filter to all the diagram or compact views across the Catalog. A user who has access to the Catalog can create and apply filters. A user with administrative privileges can create and apply a filter as the default filter to all the diagram or compact views in the Catalog.
You can also delete filters that you no longer use or edit filters. When you delete a filter, the Catalog removes the filter setting that you have applied on the Lineage and Impact view. You cannot delete a default filter unless you have the administrative privileges assigned to you.
Example 3. Example
Consider a report called Sales_distribution that has multiple assets, such as tables, files, and fields contributing to the Lineage and Impact view. As an analyst, you want to identify only the fields that contribute to the diagram or compact view so that you can use the fields for a new report that you want to build. To achieve this goal, you can open the Sales_distribution report in the Lineage and Impact view and use the Hide assets and retain their links filter to hide all the asset types except the field assets.
Lineage and Impact Filter Options
You can apply filters to the diagram or compact view in the Lineage and Impact tab based on the following filter options:
- Hide assets and retain their links
- The diagram or compact view hides specific assets that you select and displays the asset links without disrupting the data flow between the assets. For example, consider that you have opened a table in the diagram or compact view. You see that the view includes multiple asset types, such as views, tables, synonyms, and reports, participating in the data flow. You want to narrow down the results in the view to hide a few asset types and retain the asset links. To achieve this, you can create a filter with Hide assets and retain their links filter option and apply the filter to the view. After you apply the filter, the Catalog hides the asset types that you selected and displays the other assets in the diagram or compact view.
The following image shows the comparison between the diagram views:
- 1. Default diagram view
- 2. Diagram view after you apply the Hide assets and retain links filter option to the table asset.
The following image shows the comparison between the compact views:
- 1. Default compact view
- 2. Compact view after you apply the Hide assets and retain links filter option to the table asset.
- Hide assets and their links
- The diagram or compact view hides specific assets that you select, and removes the assets and links that appear following the selected assets in the data flow. For example, consider that you have opened a table named customer in the view. On the impact side, the view displays a table asset called order_details linked to a synonym asset called syn_order_details and table asset called payment. When you create a filter with Hide assets and their links filter option to hide the table asset order_details in the view, the view hides the order_details asset and removes its linked assets syn_order_details and payment from the data flow.
The following image shows the comparison between the diagram views:
- 1. Default diagram view
- 2. Diagram view after you apply the Hide assets and their links filter option to the table asset.
The following image shows the comparison between the compact views:
- 1. Default compact view
- 2. Compact view after you apply the Hide assets and their links filter option to the table asset.
- Hide assets at leaf nodes
- The diagram or compact view hides assets that participate as the endpoints in the view. A leaf node represents an asset that is at the end of either side of the view. The leaf node asset has a single link that connects to the other assets in the view. For example, consider that you have opened a table named customer in the diagram or compact view. On the lineage side, the view displays a leaf node called syn_customer, and on the impact side, the view displays a leaf node called Payment. When you create a filter with Hide assets at leaf nodes filter option to hide the table assets that are leaf nodes in the diagram or compact view. The view hides the Payment table asset type from the data flow.
The following image shows the comparison between the diagram views:
- 1. Default diagram view
- 2. Diagram view after you apply the Hide assets at leaf nodes filter option to the table asset.
The following image shows the comparison between the compact views:
- 1. Default compact view
- 2. Compact view after you apply the Hide assets at leaf nodes filter option to the table asset.
Note: The filter changes do not apply on assets if the seed asset is repeated either on the lineage or impact side.
- Relationship
- The diagram or compact view includes assets and the data flow between the assets. You can configure the type of data flow between the assets in the diagram or compact view by using the Relationship filter. By default, you can view the value flow between the assets. The value flow is displayed as a direct link (
 ) between the assets. The control flow is displayed as a dotted link (
 ) between the assets in the lineage diagram.
 - Direction
- The diagram or compact view includes multiple asset types, such as views, tables, synonyms, and reports, participating in the data flow. You can configure the direction of the data flow between assets in the diagram or compact view by using the Direction filter. By default, you can view the inflow and outflow of data for an asset.
Creating Lineage and Impact Filters
Create a filter to narrow down the results in the diagram or compact view of the Lineage and Impact tab. Create and save a customized filter so that you can frequently apply the saved filter to any diagram or compact view in the Catalog. All users with permissions and privileges to use Enterprise Data Catalog can create filters. A user with administrative permissions and privileges can create and mark a filter as default for all the diagram or compact views across the Catalog.
1. Open an asset in the Lineage and Impact tab.
2. Click the  icon in the upper right corner of the Lineage and Impact tab.
 The Apply Filter dialog box appears.
3. In the New tab of the Apply Filter dialog box, select the asset types to which you want to apply the filter.
4. Select the filter options that you want to apply to the diagram or compact view.
5. In the Name field, enter a name for the filter if you want to reuse the filter settings on another diagram or compact view later. If you do not save the filter, the filter settings are applied to the current diagram or compact view.
- - Alternatively, if you have administrative permissions and privileges, you can check the Set this filter as default option to make a filter as the default filter.
6. Click OK.
Enterprise Data Catalog saves the filter, and the filter appears in the Saved tab of the Apply Filter dialog box.
Editing Lineage and Impact Filters
After you create a filter, you might want to edit the filter to change the name of the filter, and select or clear filter options in the filter. After you edit a filter to change the filter options, the edited filter is applied to the diagram or compact view.
1. In the Saved tab of the Apply Filter dialog box, select the filter that you want to edit.
2. Click the edit icon.
The filter opens in the New tab.
3. In the New tab, edit the filter name or the filter options based on your requirements.
4. Click Save.
Applying Lineage and Impact Filters
You can instantly apply a filter, or you can apply a saved filter to the diagram or compact view. If you have administrative permissions and privileges, you can apply a filter as the default filter to all the diagrams or compact views in the Catalog. An administrator can apply a single default filter on the diagram or compact views. You can create multiple filters and apply one saved filter at a time to the diagram or compact view. To apply a new filter to the diagram or compact view that has filter applied, you must clear the existing filter.
To apply a filter setting directly to the diagram or compact view, open the New tab in the Apply Filter dialog box, select the asset types and filter options, and then click OK. To apply the filter after you save the filter setting, open the Saved tab in the Apply Filter dialog box, select the filter name that you want to apply, and then click OK.
Printing and Exporting the Diagram
You can print a lineage and impact diagram or compact view. You can also export the view to a scalable vector graphics (.svg) file. Use the menu at the upper left corner to print and export the view.
To print a diagram or compact view, open the menu (

) and select
Print.
To export the diagram to an .svg file, open the menu (
) and select
Export. The options to download the diagram or compact view vary based on the browser.
Filtering the Asset Summary
You can filter the assets in the asset summary by asset type, resource name, control type, or resource type. Use the filter panel to filter the assets.
When you open the asset summary view, the filter panel is displayed by default. Each asset summary tab displays different filter types based on the assets listed in the summary.
The following image shows all the filter types in the filter panel:

To filter the asset summary, select the asset types, resource names, resource types, and control types that you want to view. To remove all filters of a particular type, select All.
Note: The filters that you apply in the asset summary view do not apply to the lineage and impact diagram.
Exporting the Asset Summary
You can export the asset summary to a Microsoft Excel (.xlsx) file. You can export the asset lineage summary, the asset impact summary, and asset control summary. If you applied filters to the asset summary, the filtered assets do not appear in the export file.
You can also choose to export all the three types of summary information. If you export all the summary information, the Microsoft Excel file displays separate worksheets for the asset lineage summary, asset impact summary, and asset control summary.
1. Click the Export icon ( ).
). 2. Select the asset summary that you want to export. You can choose to export the Lineage Summary, Impact Summary, and Control Summary separately, or you can select all the summary information.
3. Click OK.
The options to download the file vary based on your browser.