Tabular Assets
You can view tabular assets such as relational tables, CSV files, and dimension tables in Enterprise Data Catalog. You can view details about tabular assets, check the data quality of tabular assets, rate and review tabular assets, and ask questions about tabular assets in the Overview tab.
A tabular asset is any asset that contains data that you can view in a tabular format.
The following types of assets are examples of tabular assets:
- •Business intelligence dimension, logical, and presentation tables
- •CSV, JSON, and XML files
- •Hive tables
- •Relational tables, views, and synonyms
- •Salesforce objects
The Overview tab shows different details for different types of tabular assets. For tabular assets in resources that support profiling, the Overview tab shows the system attributes, custom attributes, composite data domains, and profile results that include column names, business terms, data types, and data domains. For other tabular assets, the Overview view shows the system attributes, custom attributes, and links.
If the columns or fields in a tabular asset have profile results, you can check the quality of the column or field data from the Overview view.
You can launch Data Preparation of Informatica Intelligent Cloud Services on a separate browser window for relational tables and views. You can cleanse, transform, and structure the datasets present in the catalog using Data Preparation. You can also discover the prepared datasets in the catalog and reuse the prepared or published datasets.
Note: Effective in version 10.5.2.1, Data Preparation is available for technical preview in the Catalog tool.
Technical preview functionality is supported for evaluation purposes but is unwarranted and is not supported in production environments or any environment that you plan to push to production. Informatica intends to include the preview functionality in an upcoming release for production use, but might choose not to in accordance with changing market or technical circumstances. For more information, contact Informatica Global Customer Support.
The following image shows the sample Overview tab for a relational table:
- 1. Add a business title to the table.
- 2. Path to the table.
- 3. Follow the table.
- 4. Launch Data Preparation of Informatica Intelligent Cloud Services.
Tabular Asset Overview
The Overview tab for a tabular asset displays the details, such as the description, people associated with the asset, related business terms, composite data domains, system attributes, and column or link details.
Enterprise Data Catalog displays the following details for a tabular asset:
- Description
- The Description section displays the tabular asset description. Use the Edit Properties icon (
 ) to edit or add description for the asset. You can enter rich text as the description for the asset. Use the text formatting options to format the rich text. To add more descriptive context to the asset, you can also add multiple sections under the Description section. For example, you create and configure a rich text type custom attribute called Additional Description for the tabular asset in the Catalog Administrator. Enterprise Data Catalog displays the custom attribute as an another section under the Description section in the Overview tab.
 - Sample Columns
The Overview tab displays the sample columns for tabular assets, such as view columns, table columns, CSV fields, XML file fields, and JSON file fields, other semi-structured sources, and for sources that you can run the column profile on.
The Sample Columns section displays the following details for the sample columns:
- - Name. Displays the column or field name. To view the column or field asset details, click the column name. The column asset details appear in the Overview tab.
- - Business title. Displays the business title associated with the column. Hover the mouse over an accepted business title to view the path of the business term. You can also view the recommended business terms if you want to associate a business term as a business title with the column. Hover the mouse over a recommended business title to view the name, confidence score, and the path of the business term. You can accept or reject the inferred business titles.
- - Data Domains. Displays the data domains associated with the column. Hover the mouse over a data domain to view the Name Match, Data Match, Proximity Match, System Suggested, and Assigned by details. The inferred data domains appear in orange color and the curated data domains appear in green color.
- - Show All. To view all the columns in the asset in the Columns tab, click the Show All or click Columns.
- Reviews
- The Reviews section displays the reviews and ratings for a tabular asset. By default, the section displays a text box and five star rating scale next to the text box. To review the tabular asset, enter the review in the text box and rate the tabular asset, and then click Submit.
- The section displays the review that you provided at the top of the list of the existing reviews. You can mark any review as helpful if you find the review useful.
- The following image displays the Reviews section in the Overview tab:

- The section displays a maximum of five latest reviews. To view all the reviews, click Show All. The Reviews tab displays the complete list of reviews about the tabular asset, average ratings of the asset, and total user ratings on the tabular asset.
The following image displays the Reviews tab for a tabular asset:
- In the Reviews tab, you can review the tabular asset and filter the reviews based on the ratings.
- You can also sort the list based on the following options:
- - Recent Reviews. Sorts the reviews list based on the latest reviews.
- - Voted Most Helpful. Sorts the reviews list based on reviews that are voted as most helpful.
- - Ratings. Sorts the reviews list based on reviews with highest ratings.
- For more information about reviews, see Rate and Review Asset.
- Questions
- The Questions section displays the questions that are asked about the tabular asset. To ask a question, enter the question in the text box, and then click Submit. The section displays the question that you ask at the top of the existing questions. The questions include the answer and delete options. A user who has knowledge about the tabular asset can answer the questions asked. You can also mark an answer as helpful if you find the answer useful.
The following image displays the Questions section in the Overview tab:
- The section displays a maximum of five latest questions that are asked. To view all the questions, click Show All. The Questions tab displays the complete list of questions asked about the tabular asset.
The following image displays the Questions tab for a tabular asset:
- You can filter the questions based on the following options:
- - My Questions. Displays all the questions that you asked about the tabular asset.
- - Answered Questions. Displays all the questions that have answers.
- - Unanswered Questions. Displays all the questions without answers.
- For more information about questions, see Asset Questions.
- People
- The People section displays the users associated with the tabular asset. The section by default displays the data owner and data steward fields. The section also displays the followers of the tabular asset. Use the Edit Properties icon () to add or change the users associated with the glossary. The additional user fields that you see in the section appear after the catalog administrator creates and configures a custom attribute of User data type for a tabular asset in the Catalog Administrator.
- Custom Attributes
- The properties that the Custom Attributes section displays depends upon the different types of custom attributes the catalog administrator creates and configures for a tabular asset in the Catalog Administrator. The section displays custom attributes of data types, such as the date, string, boolean, decimal, integer, and URL. Use the Edit Properties icon () to add or change values of the properties in the section.
- System Attributes
The Overview tab displays the System Attributes section for tabular assets. The system attributes that are shown by default vary based on the parent resource type. For example, the default system attributes for a relational table include comments, data source UUID, native type, and resource name.
You can change the system attributes that are displayed in the Overview tab when you configure search filters in the Application Configuration dialog box.
- Composite Data Domains
- The Overview tab displays the Composite Data Domains section if tabular assets in resources have associated composite data domains. The section displays all the composite data domains that are inferred on the tabular asset. To view the columns that have data domains associated with the composite data domain, click the filter icon next to the composite data domain name. If the composite data domain is inferred on multiple tabular assets, you can hover over the composite data domain name link and click View Instances to view other tables on which the composite data domain is inferred. You can also click the composite data domain name link to display the Overview tab for the composite data domain.
The following image shows the Composite Data Domain section in the Overview tab of a tabular asset:
- Business Terms
- The Related Business Terms section displays custom attributes of data types, such as BusinessTerm, Glossary, AxonGlossary. The section displays related terms when the catalog administrator creates and configures the custom attribute for the tabular asset in the Catalog Administrator. You can associate multiple business terms as custom attribute values with the asset. Use the Edit Properties () to add, remove, or change the business term values.
- Classifications
- The Classifications section displays all the asset classifications based on custom attributes of reference data types. The custom attributes of a reference data type depend on how the custom attributes are defined in Informatica Business Glossary or Informatica Axon. For example, if you have a table called Sales Details and you want to classify the table based on a region. To classify the table, you can assign a custom attribute of reference data type called APAC to the table. Use the Edit Properties () to add, remove, or change the business classification values.
- Links
- The Overview tab displays the Links section for tabular assets in resources that do not support profiling. The Links section displays the child assets of the tabular asset. For example, if you view the Overview for a pivot table, the Links section displays the axes in the table. If you view a presentation table, the Links section displays the presentation columns and derived presentation columns.
Viewing Column Details
The Columns tab displays all the columns for tabular assets, such as view columns, table columns, synonym columns, public synonym columns, and for sources that you can run the column profile on.
On the Columns tab, you can view the following details for each column in the tabular asset:
- Name
- Displays column names. By default, the columns list appears in the ascending order based on the column position in the data source. To sort columns in ascending or descending order based on the source position, click the arrow (
 ) icon. To sort columns in alphabetical order by name, click the Name heading on the Columns tab. To sort columns in reverse alphabetical order, click the column heading again. To view the column asset details on the Overview tab, click the column name link.
- Business Title
- Displays the business title associated with the column. Hover the mouse over an accepted business title to view the path of the business term. You can also view the recommended business terms if you want to associate a business term as a business title with the column. Hover the mouse over a recommended business title to view the name, confidence score, and the path of the business term. You can accept or reject the inferred business titles.
- Data domains
- Displays the data domains associated with the column. Hover the mouse over a data domain to view the Name Match, Data Match, Proximity Match, System Suggested, and Assigned by details. The inferred data domains appear in orange color and the curated data domains appear in green color. The Name Match displays Yes when the column name matches with the data domain. The Proximity Match displays a score that is a ratio of the number of proximal data domains discovered in the data asset to the number of configured proximal data domains for an inferred data domain. You can accept or reject the inferred data domains. The data domains that you accept are assigned to the asset.
- Null Distinct Non-Distinct %
- Displays the percentage of null, distinct, and non-distinct values in a column. Hover the mouse over the horizontal bar chart to view the number rows that contain null, distinct, and non-distinct values.
- Source Data Type Inferred Data Types
- Displays the documented data type and inferred data types of the column. Hover the mouse to view the list of documented data type and inferred data types with percentages.
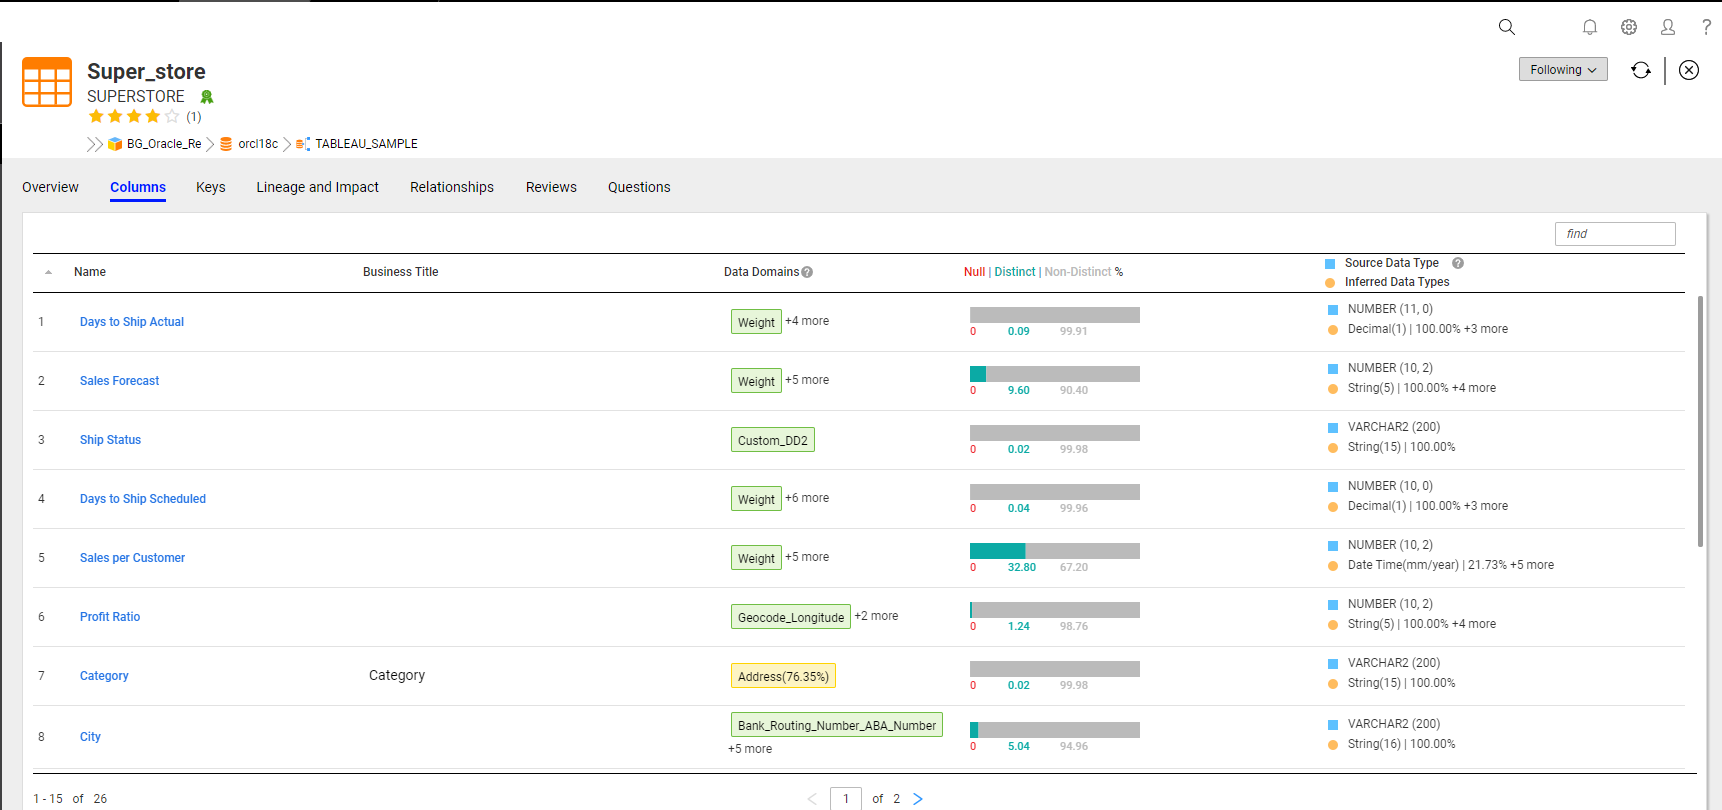
The following image displays the sample Columns tab:
Data Domain Curation for Columns and Fields from a Tabular Asset
Curation is a process to accept or reject data domains for an asset. You can curate the data domains for column and field assets from a tabular asset.
In Catalog Administrator, you can run data domain discovery on resources. In Enterprise Data Catalog, you can view the inferred data domains for column and field assets. When you configure the Auto accept if more than conformance criteria option for a resource, Enterprise Data Catalog accepts the data domain automatically when the data domain match exceeds the configured value. Data domain inference is also based on the data domains that are assigned to similar assets in Enterprise Data Catalog. When you create a data domain in Enterprise Data Catalog and assign it to a column or field, Enterprise Data Catalog infers the data domain for similar assets.
You can perform the following curation tasks for a column or field in the Columns tab of a tabular asset:
- •Accept or reject the inferred data domains for the asset.
- •Assign a data domain to the asset. If an appropriate data domain does not exist, you can create a data domain.
- •Reject an assigned data domain.
- •Accept a rejected data domain.
Note: If you accept or reject an inferred data domain for an asset, you cannot set the data domain back to the inferred status.
Assigning or Rejecting the Data Domains for a Column or Field from a Tabular Asset
Perform the following steps to accept or reject data domains from a tabular asset.
1. On the Enterprise Data Catalog home page, type a table name that contains columns or fields assets, and click the search icon.
2. On the Search Results page, click the table asset.
In the Overview tab of the asset, you can view the inferred data domains in the Sample Columns section. The Data Domain column displays the data domain name, if the column name matches the data domain, and if there is a proximity match in the asset.
3. Click the Columns tab.
The column or field asset details appear in the Columns tab.
In the Columns tab, you can view column details, such as the column name, business title, data domains, percentage distribution of null, distinct, and non-distinct values in each column, source data type, and the inferred data types.
Data domains that appear in an orange box with the inference percentage are inferred data domains. For example,

.
You can perform the following tasks on an inferred data domain:
- - Click the
 icon to accept the data domain. After you accept the data domain, the box turns green. The data domains that are auto-accepted appear in a green box. For example,
  .
. - - Click the
 icon to reject the data domain. After you reject a data domain, the data domain no longer appears as a data domain for the asset.
4. Click the more link to view the list of data domains that are assigned or inferred for the asset and the list of data domains that are rejected for the asset.
5. To assign a data domain to the asset, perform one of the following steps:
- - If the data domain appears in the Accepted & Inferred Data Domains or Rejected Data Domains list, click the icon.
- - If the data domain exists in the Model repository but does not appear in the lists, then you can create a data domain. This type of data domain is called a smart data domain.
The data domain then appears the Accepted & Inferred Data Domains list, and the Assigned By column lists your user name as the person who assigned the data domain to the asset.
6. To reject an assigned or inferred data domain, click the icon for the data domain in the Accepted & Inferred Data Domains list. The data domain moves to the Rejected Data Domains list, and the Assigned By column lists your user name as the person who rejected the data domain for the asset.
7. To accept a data domain and reject all the assigned, inferred, or accepted data domains, perform the following steps:
- a. In the Accepted & Inferred Data Domains list, select a data domain that you want to accept.
- b. Click the
 icon, and then click the Accept this, reject the rest option.
8. Click OK.
Viewing the Rules and Scorecards Information
The Data Quality tab displays the details of the rules and scorecards for a tabular asset. You can view the column results for a rule and scorecard to measure data quality of the data source.
The Rules tab displays the following details:
- •Name. Displays the rule name. Hover the mouse to view the description of the rule asset. You can view the value frequency for output columns for a particular rule. In the value frequency section, you can view the distribution of the values across the data asset, the maximum and minimum values in the data asset, the distribution of null, distinct, and non-distinct values in the data asset, and a list of values and their frequency in a tabular form. You can view the details of all the output columns associated with a rule. To view the rule asset details, click the rule name. The rule asset details appear in the Overview tab.
- •Null Distinct Non-distinct%: Displays the percentage of null, distinct, and non-distinct values in the column. You can view the number of rows that contain null, distinct, and non-distinct values.
- •Input Column. Displays the number of columns on which the rule is applied. You can view a list of the columns for a particular rule asset.
- •Value. Displays the minimum and maximum values in the rule output.
- •Length. Displays the minimum and maximum length of the values in the rule output.
- •Data Type. Displays the data type of the rule. Hover the mouse over a data type to view the details of the documented data type or inferred data type.
The following image displays the Rules section in the Data Quality tab:

The Scorecards tab displays the following details:
- •Name. Displays the scorecard name. To view the scorecard asset details, click the scorecard name. The scorecard asset details appear in the Overview tab.
- •Total Metric Groups. Displays the total number of metric groups in the scorecard.
- •Metric Groups. Displays the name of the metric groups. You can view the percentage of values for each metric group. You can apply filters to view good, acceptable, or unacceptable range of data for each metric group. You can also apply filters to choose metric groups associated with a scorecard asset. You can view scorecards in the ascending or descending order of date.
- •Tables Applied. Displays the tables associated with the scorecard.
The following image displays the Scorecard section in the Data Quality tab:

Checking the Data Quality of Tabular Assets
You can check the data quality of tabular assets in resources that support profiling such as relational tables, relational views, CSV files, JSON files, XML files, and Salesforce objects. If the assets have profile results, Enterprise Data Catalog shows the distribution of data in a separate Sample Columns view. To display the detailed Sample Columns view, click Show All in the Sample Column section.
The following image shows the sample of the Columns view for a relational table with profile results:
- 1. Bar charts that show the percentage of null values, distinct values, and non-distinct values in each field.
- 2. Colums view that displays profile results, data domains, business title, and column names.
The bar chart for each column or field shows the percentage of null values, distinct values, and non-distinct values in the column or field. To view the number of rows associated with each percentage, hover the cursor over the bar chart.
Viewing the Unique Key Details
A unique key is a column or combination of columns that uniquely identifies a row in a data source. Unique key discovery identifies the unique keys that meet a specific confidence score.
The Keys tab displays the details of the unique keys and foreign keys for assets such as tables and files.
The Unique Keys section displays the following details:
- •Key Name. Displays the name of the key.
- •Columns. Displays columns that are identified as the unique keys. Drag and expand the Columns field to view all the columns identified as unique keys. If there are multiple columns with long column names, hover the mouse over the column names to display the tooltip. The tooltip displays all the column names. To view the details of a column, click the column name. The column asset details appear in the Overview tab.
- •Description. Displays the key description.
- •Confidence Score. Displays the score assigned to the unique key. The confidence score is calculated by an internal algorithm based on the uniqueness of data in the columns, number of null values and the position of discovered columns in the source data object.
- •Type. Displays the type of unique key. Unique keys can be documented, inferred, accepted, or rejected. You can curate unique key results in the Enterprise Data Catalog. Hover the mouse over the key name to accept or reject the columns inferred as the unique key. The inferred type appears in orange color, accepted type appears in green color and rejected type appears in red color. You can click Undo Accept or Undo Reject to reset the unique key results to the inferred state. Hover over (
 ) to view the details of the person who accepted or rejected the inferred unique key results.
You can click the Show tab to view documented, inferred, accepted, rejected, or all types of unique key results. The Show tab displays all types of unique key results by default. You can enter a key name or column name in the Find tab to search the unique key inference. You can discover a maximum of five unique keys in each table in the source data object. You can search documented or inferred keys in the Enterprise Data Catalog tool.
You can also view the relationship between the asset and the unique keys of tables related to the asset in the Relationships tab. In the Relationships tab, you can click on the name of the related table from the Primary Keys circle to navigate to the Relationships tab of the related table.
You can also click on
Show All to open the
Tables dialog box and view the type of relationship between the asset and the related tables. In the
Tables dialog box, you can click on the relationship and navigate to the
Unique Keys or
Foreign Keys tab of the related table. For more information on the Relationships view of an asset, see
View Relationships.
Viewing the Foreign Key Details
In a relational database, a column or a set of columns whose value corresponds to a primary key value in another table is referred to as a foreign key. A foreign key acts as a pointer to the primary key of another table. For example, the Department_Number column in the Employee table would be a foreign key that points to the primary key of the Department table.
The Keys tab displays details of the unique keys and foreign keys for assets such as tables and files.
The Foreign Keys section displays the following details:
- •Key Name. Displays the name of the foreign key.
- •Columns. Displays the parent column that the foreign key refers to along with the table name. Drag and expand the Columns field to view all the columns identified as foreign keys. If there are multiple columns with long column names, hover the mouse over the column names to display the tooltip. The tooltip displays all the column names. To view the details of a column, click the column name. The column asset details appear in the Overview tab.
- •Description. Displays the description of the foreign key.
- •Business Title. Displays the business title associated with the foreign key.
For example, in the above figure STUDENT_BRANCH_DETAILS.STU_BRANCH indicates that STU_BRANCH is the parent column to which the foreign key refers to and STUDENT_BRANCH_DETAILS is the table that contains the parent column.
A table can have foreign keys relationships with more than one table. A table can have foreign key relationships with more than one column of the same table.
You can enter a key name or column name in the Find tab to search for foreign keys.
You can view the relationship between the asset and the foreign keys of tables related to the asset in the Relationships tab. In the Relationships tab of the asset, you can click on the name of the related table from the Foreign Keys circle to navigate to the Relationships tab of the related table.
You can also click on
Show All to open the
Tables dialog box and view the type of relationship between the asset and the related tables. In the
Tables dialog box, you can click on the relationship and navigate to the
Unique Keys or
Foreign Keys tab of the related table. For more information on the Relationships view of an asset, see
View Relationships.