History View
The History view displays historical data for the domain, a service, or a node. You can view historical data for the contents panel, Service State Summary, resource usage indicators, and Details panel. You can also view information about events in the domain.
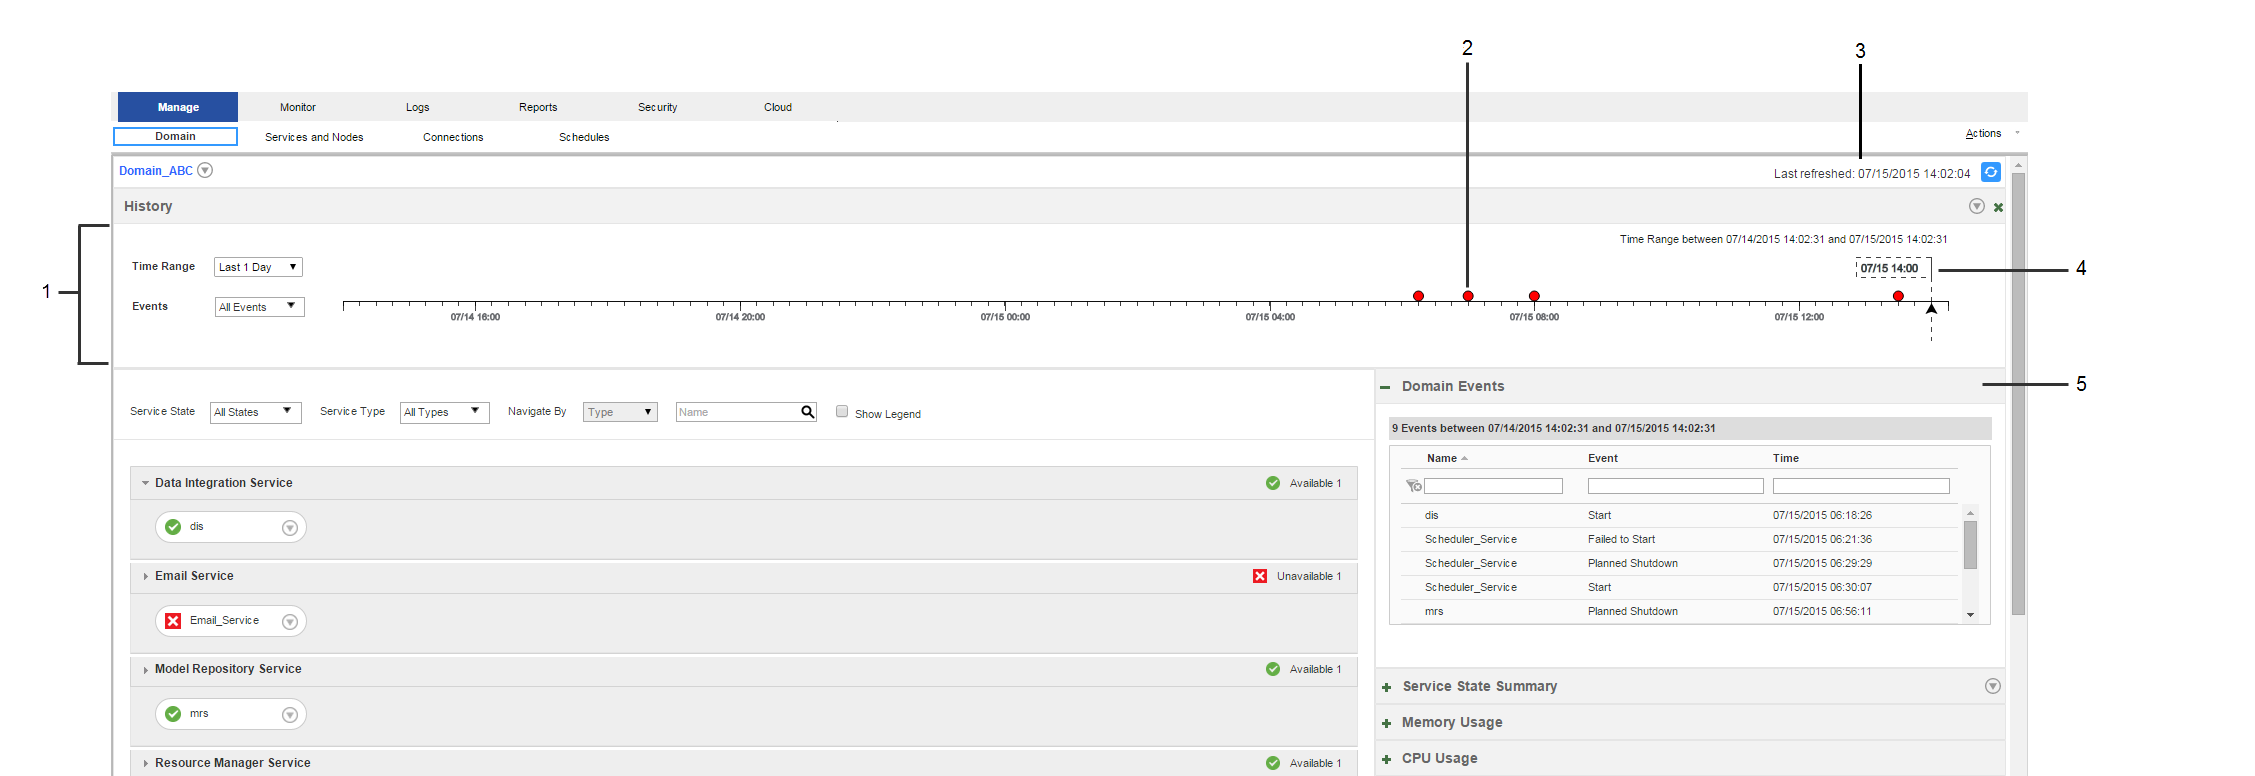
The following image shows the History view:

- 1. Time line
- 2. Event circle
- 3. Last Refreshed
- 4. Time line slider
- 5. Events panel
The History view has the following components:
- Time line
- Use the time line to choose which time range and events you would like to view. When events occur around a point in time, the point is marked with a red event circle. When you select a circle, the Events panel displays the events that occurred around that point in time. By default, the time line displays crashes and unplanned shutdowns that occurred in the last one day.
- Events panel
- Displays events that occurred during a specified time range. When you open the History view, the panel lists crashes and unplanned shutdowns that occurred in the last one day.
- Contents panel
- Displays current and historical domain contents and states. When you open the History view, the contents panel shows domain objects and states at the last refresh. When you drag the time line slider to a point in time, the contents panel shows domain objects and states at that point in time.
- Service State Summary
- Displays current and historical service state summaries. When you open the History view from the domain Actions menu, the Service State Summary appears and displays the number and states of services at the last refresh. When you drag the time line slider to a point in time, the Service State Summary displays the number of services that were available or unavailable at that time.
- Details panel
- Displays current and historical state for a service or node. When you open the History view, the Details panel displays the state of the service or node at the last refresh. When you drag the time line slider to a point in time, the Details panel displays the object state at that point in time.
- Resource usage indicators
- Display current and historical resource usage information. When you open the History view, the usage indicators display the usage statistics as they appeared at the last refresh. When you drag the time line slider to a point in time, the indicators display statistics for that point in time.
The data that you view in the History view is stored in the monitoring Model repository. Before you can view historical data, you must configure the monitoring Model repository in the Manage > Services and Nodes > Monitoring Configuration tab. You can view the per-minute data for up to two weeks in the past. After two weeks, the statistics that you view are hourly averages. You can view hourly averaged data for up to one year in the past.
Note: The monitoring Model Repository Service that you configure to store the historical data cannot capture data about events that occur while it is unavailable or disabled. For example, Start events for the monitoring Model Repository Service and Crash events for the node that the monitoring Model Repository Service process runs on do not appear in the History view.
Viewing History
You can view historical statistics for the domain, a service, or a node.
The amount of history that you can view depends on the monitoring Model repository options that you configure in the Monitoring Configuration tab. You must configure a monitoring Model repository in the Monitoring Configuration tab before you can view historical statistics.
1. To access the History view, click the Actions menu for the domain, a service, or a node, and then select View History.
The History view opens. The auto-refresh pauses at the Last Refreshed time stamp. The time line and Events panel display and display crashes and unplanned shutdowns that occurred in the last one day.
2. To change the time range, select a time range in the Time Range list.
When you change the time range, the time line refreshes and displays the selected time range.
3. To choose a custom time range, select Custom in the Time Range list.
You can select a custom time range from one hour to one month.
4. To change the events that display, select events in the Events list.
You can view information about the following events:
- - Crash
- - Failed to Start
- - Unplanned Shutdown
- - Planned Shutdown
- - Start
When you select different events, the time line refreshes and reflects the change.
5. To view historical statistics about the domain, drag the time line slider to a point in time.
The History view refreshes and displays the domain status at that point in time.
6. To exit the History view, click Close.
Note: Current services display as Unavailable when the time range begins before they were created.
Viewing Events
You can view events for the domain, a node, or a service.
1. To view events, click the Actions menu for the domain, a node, or a service, and then choose View History.
The History view opens and displays the Events panel. By default, the Events panel lists crashes and unplanned shutdowns that have occurred in the last one day.
- 2. You can view the following information about events:
- - Object name
- - Object type
- - Event type
- - Time the event occurred
- - Name of the associated node
- - Comments about recycled or disabled services
- - Comments about shut down nodes
3. Optionally, you can complete the following actions in the Events panel:
Option | Description |
|---|
Search events | Type the search criteria in the search field, and then press enter. To clear the search, click the Reset Filters icon. |
Sort a column | To sort a column in ascending order, click the column header. To sort the column in descending order, click the column header again. |
Add or remove columns | To change the columns that appear in the Events panel, right-click a column header, and then select or deselect a column. |
Reset filter | When you click a circle on the time line, you can clear the selection by clicking Reset filters. |
