Manage Tab - Domain View
The Domain view displays an overview of the domain and its contents. You can use the domain view to monitor the domain status, resource consumption, and events. You can also perform domain actions, such as enabling and disabling services.
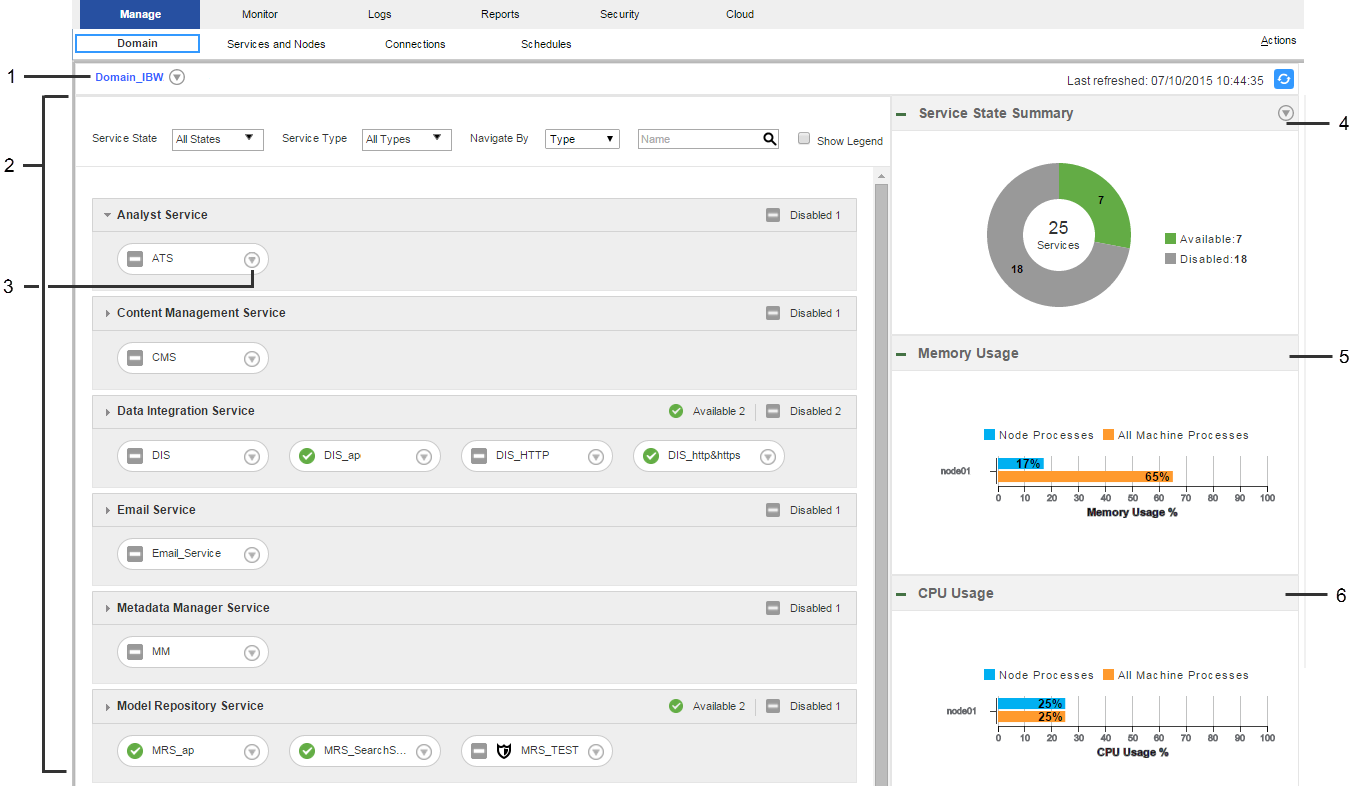
The following image shows the Domain view on the Manage tab:
- 1. Domain Actions menu
- 2. Contents panel
- 3. Object Actions menu
- 4. Service State Summary
- 5. Memory usage indicator
- 6. CPU usage indicator
The Domain view has the following components:
- Domain Actions menu
- Use the Domain Actions menu to view more information about the domain or shut down the domain.
- Use the Domain Actions menu to perform the following tasks:
- - View Properties. Open the Services and Nodes view and display the properties for the domain.
- - View History. Open the History view and display domain events from the last day.
- - View Logs. Open the Logs tab and display Service Manager log events from the last day.
- - View Command History. Open the Command History panel and display the 50 most recent service lifecycle commands that were issued from the Administrator tool.
- - Shut Down Domain.
- Contents panel
- Displays domain objects and their states. Domain objects include services, nodes, and grids.
The following table describes the methods that you can use to view objects in the contents panel:
Method | Description |
|---|
Service State | Filter services by the following states: - - All states
- - Available
- - Unavailable
- - Disabled
|
Service Type | Filter some or all services in the domain. |
Navigate by | Group objects by node, type, or folder. |
Search | Search for an object by name. You can use an asterisk (*) as a wildcard character in this field. |
Show Legend | View a list of state icons and descriptions. |
- Object Actions menus
- Objects in the contents panel have Actions menus. Use the Actions menus to view information about domain objects or perform common tasks. The information you can view and the tasks that you can perform vary depending on which object you select.
Use the service Actions menu to perform the following tasks:
- - View Properties. Open the Services and Nodes view and display the properties for the service.
- - View History. Open the History view and display service events from the last day.
- - View Logs. Open the Logs tab and display service log events from the last day.
- - View Dependencies. Open the Dependency graph and display direct dependencies for the service.
- - Recycle Service.
- - Enable or Disable Service.
Use the node Actions menu to perform the following tasks:
- - View Properties. Open the Services and Nodes view and display properties for the node.
- - View History. Open the History view and display node events from the last day.
- - View Dependencies. Open the Dependency graph and display direct dependencies for the node.
- - Shut Down Node
Use the grid Actions menu to perform the following tasks:
- - View Properties. Open the Services and Nodes view and display properties for the grid.
- - View Dependencies. Open the Dependency graph and display direct dependencies for the grid.
- Service State Summary
- Doughnut chart that shows the number and state of the services in the domain. When you click a state in the chart, the contents panel displays services with that state.
- Resource usage indicators
- Bar charts that compare resource usage of a domain process to resource usage of all processes on the machine. The Domain view contains a memory usage indicator and a CPU usage indicator.
- Manage tab Actions menu
- Access help for the Domain view.
Details Panel
When you select a domain object, the Details panel displays information about the object. The information that you can view varies depending on which object you select.
The following table describes the details that display depending on the object that you select in the contents panel:
Object | Details Panel Content |
|---|
Node | Node name and state. Click the node name to view the node properties. |
Service | The Details panel displays the following content for a service: - - Service name and state. Click the service name to view the service properties.
- - Node on which the service process runs. Click the node name to view the node properties.
- - State of the node on which the service process runs.
- - State of the service process.
|
Service running on a grid | The Details panel displays the following content for a service that runs on a grid: - - Service name and state. Click the service name to view the service properties.
- - Nodes in the grid. Click a node name to view the node properties.
- - State of the nodes on which the service processes run.
- - State of the service processes.
|
Service in high availability mode | The Details panel displays the following content for a service that is highly available: - - Service name and state. Click the service name to view the service properties.
- - Nodes on which the service is configured to run. Click a node name to view the node properties.
- - State of the nodes on which the service processes run.
- - State of the service process on the nodes.
|
Grid | The Details panel displays the following content for a grid: - - Grid name and state. Click the grid name to view the grid properties.
- - Nodes in the grid. Click a node name to view the node properties.
- - State of nodes running in the grid.
|
Resource Usage Indicators
The resource usage indicators are bar charts and graphs that compare resource usage for a domain process to resource usage of all processes on the machine. Select a domain process to compare with all processes. You can view current usage statistics or statistics for the previous 60 minutes.
You can view usage statistics for memory and CPU. Choose whether to view current statistics or to view graphs of usage for the past 60 minutes. Click the selection arrow and choose Current or Last Hour Trend.
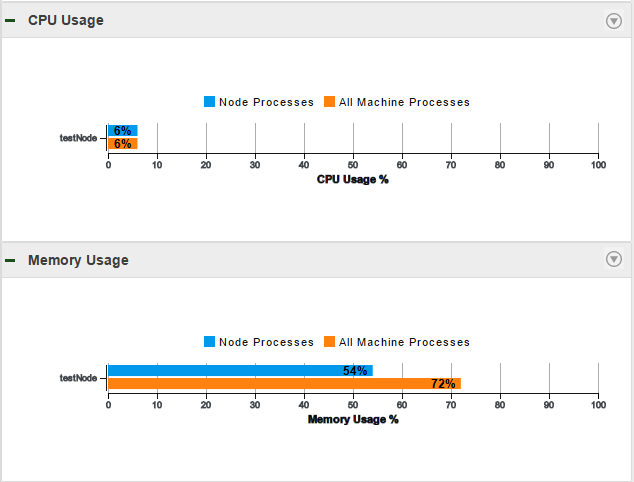
The following image shows the current resource usage in a domain that contains one node:
The information that the graphs display varies based on which domain object you select.
The following table describes the information that you can view when you select the domain or a domain object:
Domain Object | Usage Indicator Content |
|---|
Domain | The usage indicators display the following content: - - Nodes in the domain.
- - Resource usage of all processes running on each node in the domain.
- - Resource usage of all processes running on the machine.
|
Node | The usage indicators display the following content: - - The node.
- - Resource usage of processes running on the node.
- - Resource usage of all processes running on the machine.
|
Service | The usage indicators display the following content: - - The node on which the service process runs.
- - Resource usage of the service process that is running on the node.
- - Resource usage of all processes running on the machine.
|
Service in high availability mode | The usage indicators display the following content: - - The node on which the service process is running.
- - Resource usage of the service process that is running on the node.
- - Resource usage of all processes running on the machine.
|
Service running on a grid | The usage indicators display the following content: - - All nodes on which the service process runs.
- - Resource usage of the service process that is running on each node.
- - Resource usage of all processes running on the machine.
|
Grid | The usage indicators display the following content: - - All available nodes in the grid.
- - Resource usage of all processes running on each node in the domain.
- - Resource usage of all processes running on the machine.
|
If a See More… link appears in the indicator, you can click it to view the complete list of nodes in the domain. You can sort the list by node name, process usage on the nodes, or process usage on the machine. You can also search the list for a particular node.


