Monitor Tab - Execution Statistics View
On the Execution Statistics view on the Monitor tab, you can monitor Data Integration Services and objects that the Data Integration Services run.
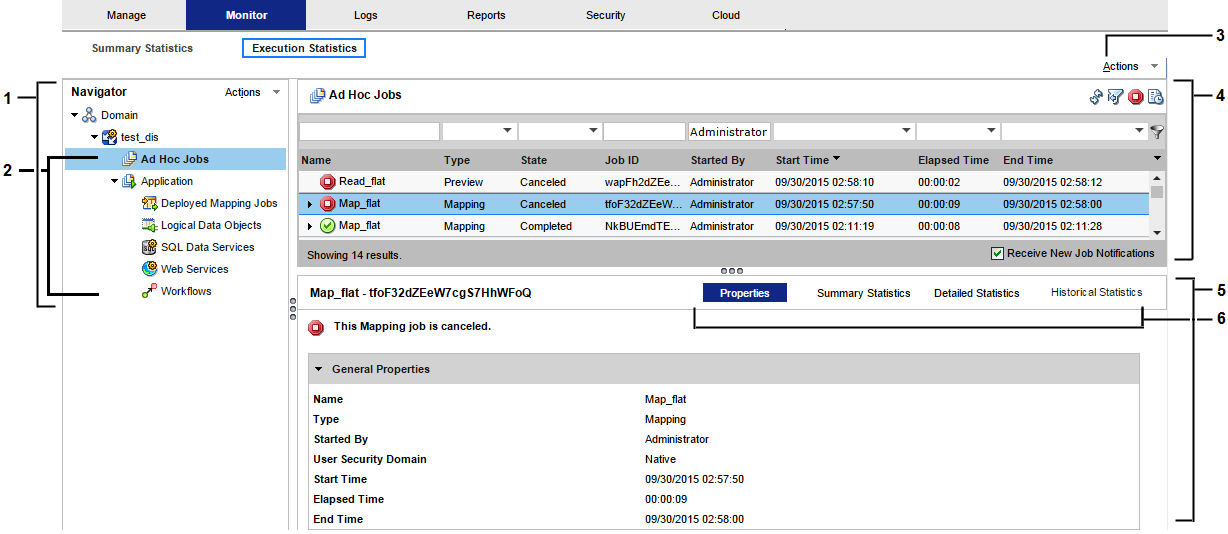
The following image shows the Execution Statistics view on the Monitor tab:
- 1. Navigator
- 2. Folders
- 3. Actions menu
- 4. Contents panel
- 5. Details panel
- 6. Views in the details panel
When you select an object in the Navigator, you can view details about the object and monitor the object.
You can select the following types of objects in the Navigator in the Execution Statistics view:
- Domain
- View the states and properties of Data Integration Services in the domain.
- Data Integration Service
- View general properties about the Data Integration Service, and view statistics about objects that the Data Integration Service runs.
- Folder
- View a list of objects in the folder. The folder is a logical grouping of objects. When you select a folder, a list of objects appears in the contents panel. The contents panel shows multiple columns that show properties about each object. You can configure the columns that appear in the contents panel.
The following table shows the folders that appear in the Navigator:
Folder | Location |
|---|
Ad Hoc Jobs | Appears under the Data Integration Service. |
Deployed Mapping Jobs | Appears under the corresponding application. |
Logical Data Objects | Appears under the corresponding application. |
SQL Data Services | Appears under the corresponding application. |
Web Services | Appears under the corresponding application. |
Workflows | Appears under the corresponding application. |
Views in the Execution Statistics View
When you select an integration object in the Navigator or an object link in the contents panel of the Execution Statistics view, multiple views of information appear in the contents panel. The views show information about the selected object, such as properties, run-time statistics, and run-time reports.
Depending on the type of object you select in the Navigator, the contents panel might display the following views:
- Properties view
- Shows general properties and run-time statistics about the selected object. General properties might include the name and description of the object. Statistics vary based on the selected object type.
- Statistics view
- Shows historical statistics about jobs in an application, or jobs that the Data Integration Service ran. For example, when you select an application, you can view the number of deployed mapping jobs that failed in the last four hours.
- Reports view
- Shows reports for the selected object. The reports contain key metrics for the object. For example, you can view reports to determine the longest running jobs on a Data Integration Service during a particular time period.
- Summary Statistics view
- Shows throughput and resource usage statistics for ad hoc mapping jobs, deployed mapping jobs, or mappings in a workflow.
- Detailed Statistics view
- Shows graphs of the throughput and resource usage for ad hoc mapping jobs, deployed mapping jobs, or mappings in a workflow.
- Historical Statistics view
Shows averaged data from multiple runs for a specific job. For example, you can view the minimum, maximum, and average duration of the mapping job. You can view the average amount of CPU that the job consumes when it runs.
- Connections view
- Shows connections defined for the selected object. You can view statistics about each connection, such as the number of closed, aborted, and total connections.
- Requests view
- Shows details about requests. There are two types of requests: SQL queries and web service requests. Users can use a third-party client tool to run SQL queries against the virtual tables in an SQL data service. Users can use a web service client to run web service requests against a web service. Each web service request runs a web service operation.
A request is a web services request or an SQL query that a user runs against a virtual table in an SQL data service.
- Virtual Tables view
- Shows virtual tables defined in an SQL data service. You can also view properties and cache refresh details for each virtual table.
- Operations view
- Shows the operations defined for the web service.
Statistics in the Execution Statistics View
When you select a Data Integration Service or an application in the Navigator in the Execution Statistics view, the Statistics section in the Properties view shows statistics for jobs that run on the Data Integration Service.
The following table describes the types of jobs and statistics that you can view:
Object Type | Statistics |
|---|
Ad Hoc Jobs | Displays the following statistics about ad hoc jobs: - - Total. Total number of jobs.
- - Failed. Number of failed jobs.
- - Aborted. Number of aborted jobs. The Data Integration Service was recycled, or disabled in the abort mode when the job was running.
- - Completed. Number of completed jobs.
- - Canceled. Number of canceled jobs.
|
Applications | Displays the following statistics about application: - - Total. Total number of applications.
- - Running. Number of running applications.
- - Failed. Number of failed applications.
- - Stopped. Number of stopped applications.
- - Disabled. Number of disabled applications.
|
Deployed Mapping Jobs | Displays the following statistics about deployed mapping jobs: - - Total. Total number of deployed mappings.
- - Failed. Number of failed mapping jobs.
- - Aborted. Number of aborted mapping jobs.
- - Completed. Number of completed mapping jobs.
- - Canceled. Number of canceled mapping jobs.
|
Connections | Displays the following statistics about SQL data service connections to virtual databases: - - Total. Total number of connections.
- - Closed. Number of database connections on which SQL data service requests have previously run.
- - Aborted. Number of connections that were manually aborted, or that were aborted when the Data Integration Service was recycled or disabled in abort mode.
|
Requests | Displays the following statistics about SQL data service and web service requests: - - Total. Total number of requests.
- - Completed. Number of completed requests.
- - Aborted. Requests that were aborted when the Data Integration Service was recycled, or disabled in abort mode.
- - Failed. Number of failed requests.
|
Workflows | Displays the following statistics about workflows: - - Total. Total number of workflow instances.
- - Completed. Number of completed workflow instances.
- - Canceled. Number of canceled workflow instances.
- - Aborted. Number of aborted workflow instances.
- - Failed. Number of failed workflow instances.
|
Reports on the Execution Statistics View
You can view monitoring reports in the Reports view of the Execution Statistics view. The Reports view appears when you select the appropriate object in the Navigator. You can view reports to monitor objects deployed to a Data Integration Service, such as ad hoc jobs, web services, SQL data services, and workflows.
The reports that appear in the Reports view vary depending on which object you select. To view reports in the Reports view, you must configure them in Monitor tab Actions > Report and Statistic Settings. By default, no reports appear in the Reports view.
You can view the following monitoring reports:
- Longest Duration Ad Hoc Jobs
- Shows ad hoc jobs that ran the longest during the specified time period. The report shows the job name, ID, type, state, and duration. You can view this report in the Reports view when you monitor a Data Integration Service in the Monitor tab.
- Longest Duration Mapping Jobs
- Shows mapping jobs that ran the longest during the specified time period. The report shows the job name, state, ID, and duration. You can view this report in the Reports view when you monitor a Data Integration Service in the Monitor tab.
- Longest Duration Profile Jobs
- Shows profile jobs that ran the longest during the specified time period. The report shows the job name, state, ID, and duration. You can view this report in the Reports view when you monitor a Data Integration Service in the Monitor tab.
- Longest Duration Reference Table Jobs
- Shows reference table process jobs that ran the longest during the specified time period. Reference table jobs are jobs where you export or import reference table data. The report shows the job name, state, ID, and duration. You can view this report in the Reports view when you monitor a Data Integration Service in the Monitor tab.
- Longest Duration Scorecard Jobs
- Shows scorecard jobs that ran the longest during the specified time period. The report shows the job name, state, ID, and duration. You can view this report in the Reports view when you monitor a Data Integration Service in the Monitor tab.
- Longest Duration SQL Data Service Connections
- Shows SQL data service connections that were open the longest during the specified time period. The report shows the connection ID, SQL data service, connection state, and duration. You can view this report in the Reports view when you monitor a Data Integration Service, an SQL data service, or an application in the Monitor tab.
- Longest Duration SQL Data Service Requests
- Shows SQL data service requests that ran the longest during the specified time period. The report shows the request ID, SQL data service, request state, and duration. You can view this report in the Reports view when you monitor a Data Integration Service, an SQL data service, or an application in the Monitor tab.
- Longest Duration Web Service Requests
- Shows web service requests that were open the longest during the specified time period. The report shows the request ID, web service operation, request state, and duration. You can view this report in the Reports view when you monitor a Data Integration Service, a web service, or an application in the Monitor tab.
- Longest Duration Workflows
- Shows all workflows that were running the longest during the specified time period. The report shows the workflow name, state, instance ID, and duration. You can view this report in the Reports view when you monitor a Data Integration Service or an application in the Monitor tab.
- Longest Duration Workflows Excluding Human Tasks
- Shows workflows that do not include a Human task that were running the longest during the specified time period. The report shows the workflow name, state, instance ID, and duration. You can view this report in the Reports view when you monitor a Data Integration Service or an application in the Monitor tab.
- Minimum, Maximum, and Average Duration Report
- Shows the minimum, maximum, and average duration for SQL data service and web service requests during a specified time period. You can view this report in the Reports view when you monitor a Data Integration Service, an SQL data service, a web service, or an application in the Monitor tab.
- Most Active IP for SQL Data Service Requests
- Shows the total number of SQL data service requests from each IP address during the specified time period. You can view this report in the Reports view when you monitor a Data Integration Service, an SQL data service, or an application in the Monitor tab.
- Most Active SQL Data Service Connections
- Shows SQL data service connections that received the most connection requests during the specified time period. The report shows the connection ID, SQL data service, and the total number of connection requests. You can view this report in the Reports view when you monitor a Data Integration Service, an application, or an SQL data service in the Monitor tab.
- Most Active Users for Ad Hoc Jobs
- Shows users that ran the most number of ad hoc jobs during the specified time period. The report shows the user name and the total number of jobs that the user ran. You can view this report in the Reports view when you monitor a Data Integration Service in the Monitor tab.
- Most Active Web Service Client IP
- Shows IP addresses that received the most number of web service requests during the specified time period. You can view this report in the Reports view when you monitor a Data Integration Service, an application, a web service, or web service operation in the Monitor tab.
- Most Frequent Errors for Ad Hoc Jobs
- Shows the most frequent errors for ad hoc jobs, regardless of job type, during the specified time period. The report shows the job type, error ID, and error count. You can view this report in the Reports view when you monitor a Data Integration Service in the Monitor tab.
- Most Frequent Errors for SQL Data Service Requests
- Shows the most frequent errors for SQL data service requests during the specified time period. The report shows the error ID and error count. You can view this report in the Reports view when you monitor a Data Integration Service, an SQL data service, or an application in the Monitor tab.
- Most Frequent Faults for Web Service Requests
- Shows the most frequent faults for web service requests during the specified time period. The report shows the fault ID and fault count. You can view this report in the Reports view when you monitor a Data Integration Service, a web service, or an application in the Monitor tab.
Summary Statistics View
You can view throughput and resource information for mapping jobs in the Execution Statistics view.
When you select an ad hoc mapping job, deployed mapping job, or mapping in a workflow in the contents panel, the details panel displays the Summary Statistics view. The Summary Statistics view displays run-time statistics about the throughput and resource usage for the job. The run-time period begins when the Data Integration Service starts reading from the first row.
You can view the following throughput statistics for the job:
- •Source. The name of the mapping source file.
- •Target name. The name of the target file.
- •Rows. Number of rows read for source and target.
- •Average Rows/Sec. Average number of rows read per second for source and target.
- •Bytes. Number of bytes read for source and target.
- •Average Bytes/Sec. Average number of bytes read per second for source and target
- •First Row Accessed. The date and time when the Data Integration Service started reading the first row in the source file.
- •Dropped rows. Number of source rows that the Data Integration Service did not read.
- •Rejected Rows. Number of target rows that the Data Integration Service did not write to target.
You can view the following resource usage statistics for the job:
- •Executing node. Node where the Data Integration Service that ran the job is running.
- •Average CPU usage. The average amount of CPU that the Data Integration Service used to run the job.
- •Average Memory usage. The average amount of memory that the Data Integration Service used to run the job.
Detailed Statistics View
You can view graphs of the throughput and resource information for mapping jobs that run longer than one minute.
When you select an ad hoc mapping job, deployed mapping job, or mapping in a workflow in the contents panel of the Execution Statistics view, the details panel displays the Detailed Statistics view. The Detailed Statistics view displays run-time statistics about the throughput and resources usage for the job. The run-time period begins when the Data Integration Service starts reading from the first row.
The Detailed Statistics view displays the following graphs:
- Throughput graph
- Plots the number of rows read and written against the run time of the job.
- CPU Usage graph
- Plots the percentage of the Data Integration Service CPU that was allocated to run the job against the run time of the job.
- Memory Usage graph
- Plots the amount of memory, in megabytes, that the Data Integration Service allocated to run the job against the run time of the job.