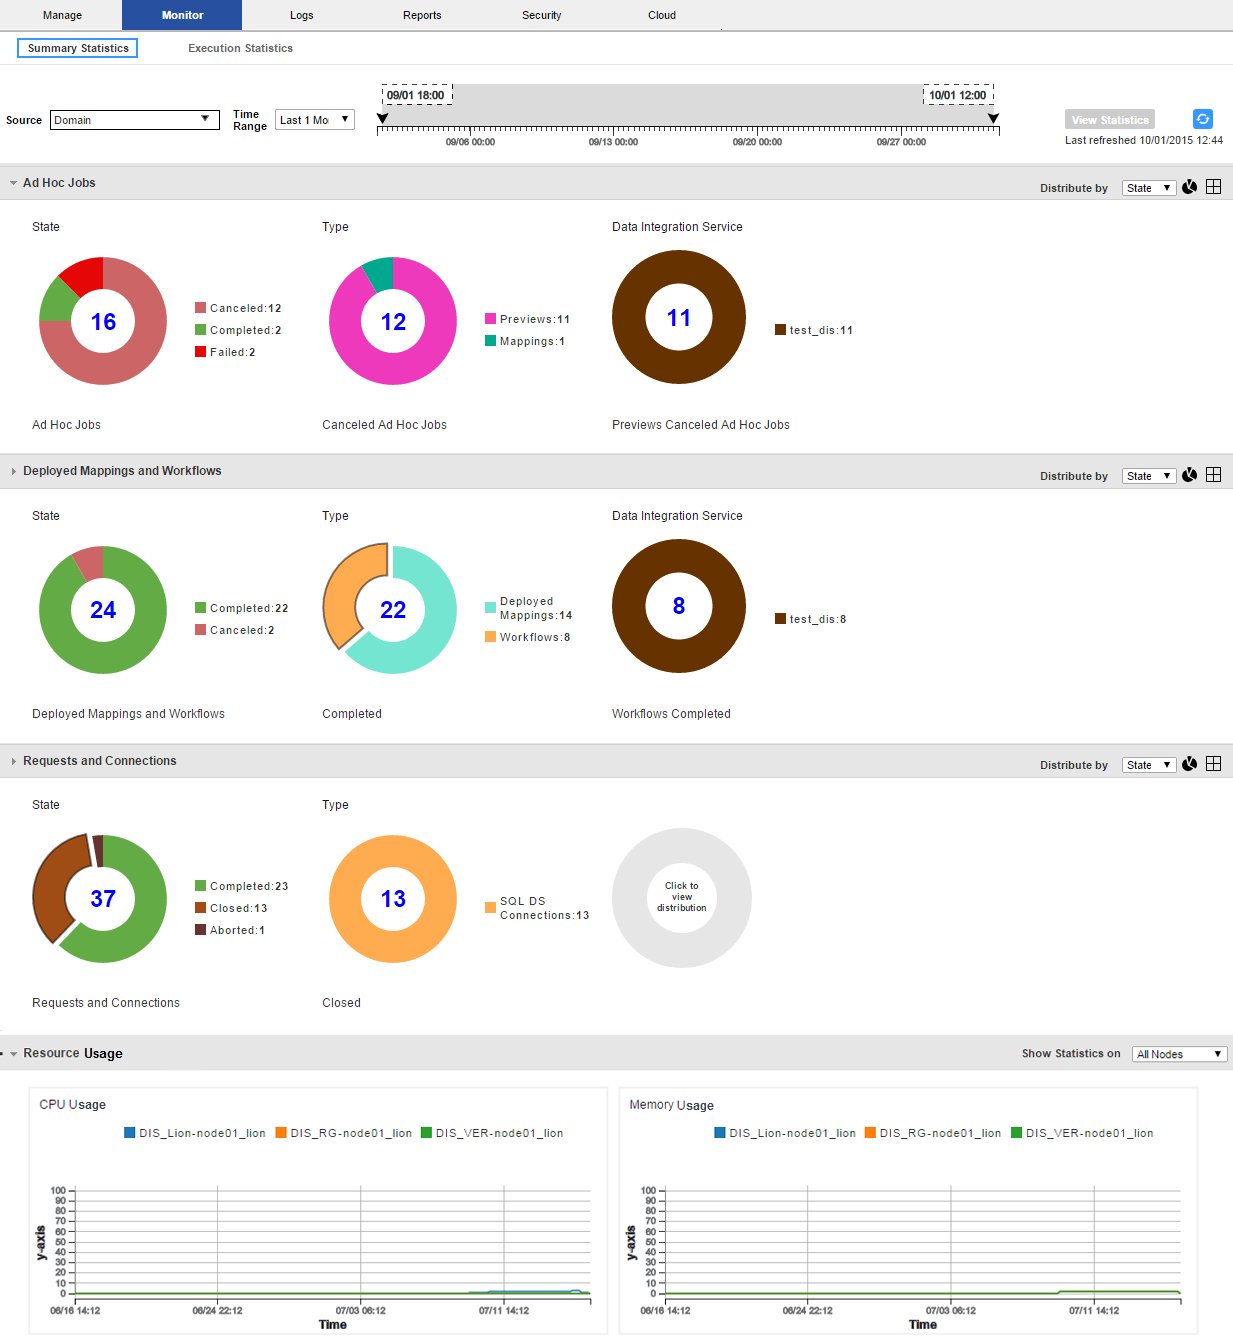
Monitor Tab - Summary Statistics View
The Summary Statistics view displays historical statistics about Data Integration Services and the jobs that they run.
The following image shows the Summary Statistics view:
Use the Summary Statistics view to view graphical information about object state, distribution, and resource usage.
The Summary Statistics view contains the following components:
- Time line
- Specify a source and time range for which you want to view statistics.
- Ad Hoc Jobs panel
- View doughnut or tabular charts for jobs for the selected source and time range. Select sections of the doughnuts to filter by job type, state, and Data Integration Service.
- Deployed Mappings and Workflows panel
- View doughnut or tabular charts for deployed mappings and workflows for the selected source and time range. Select sections of the doughnuts to filter by type, state, and Data Integration Service.
- Requests and Connections panel
- View doughnut or tabular charts for Data Integration Service jobs for the selected source and time range. Select sections of the doughnuts to filter by object type, state, and Data Integration Service.
- Resource Usage panel
- View CPU and memory usage of all of the Data Integration Service processes that are running in the domain or on a node in the domain.

