
Task | Description |
|---|---|
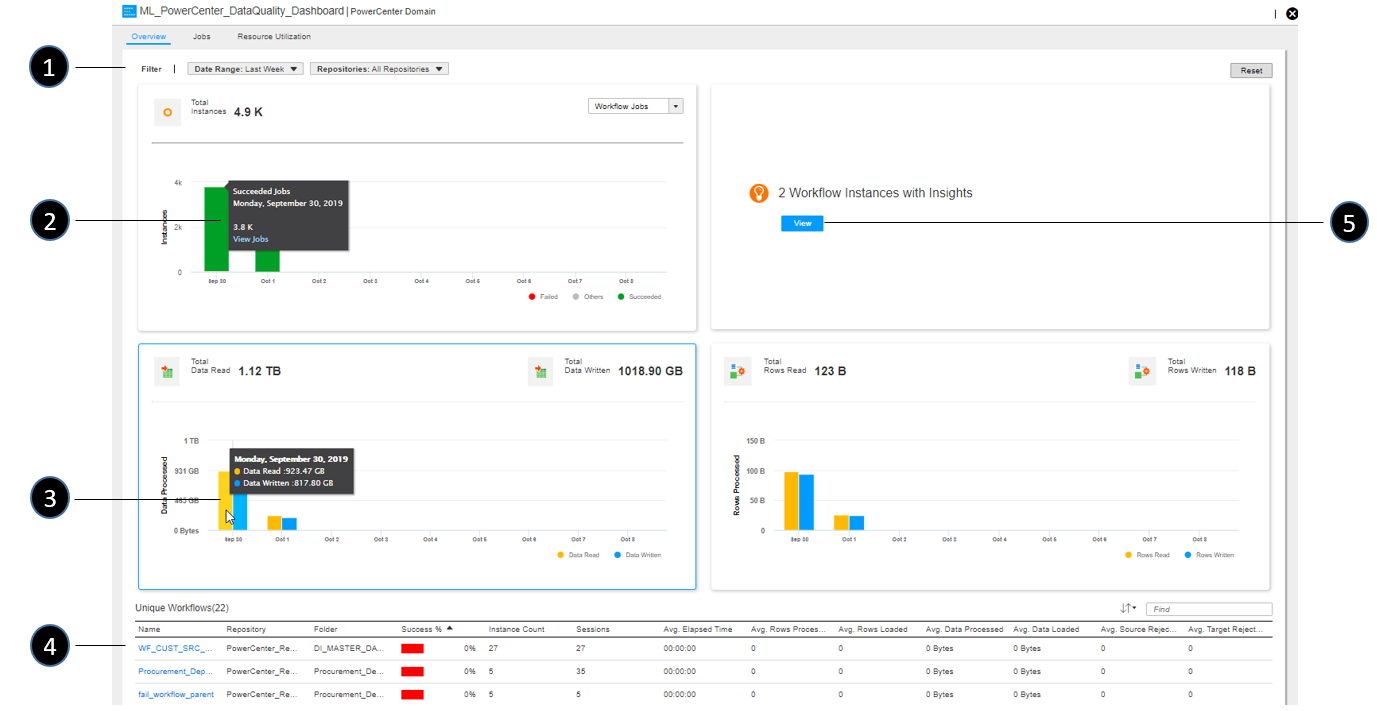
1 | Use filters to select the date range and repositories and folders to view data for. The data displayed in the Overview page is updated based on your filter settings. |
3 | In the Total Instances chart, choose whether to view data based on workflow jobs or session tasks. Hover over a bar segment in the chart, and then click View Jobs to view details. |
3 | Move your cursor across the Total Data Read and Total Rows Read charts to view details for the time range specified in the filter. |
4 | Click a workflow in the Unique Workflows region to view detailed workflow instance statistics for the selected date range and repositories. See Viewing PowerCenter workflow analytics for details. |
5 | Click View to display a list of workflow instances in which the CLAIRE engine has detected anomalous or abnormal behavior. See Viewing anomalous workflow run behavior for details. |